드릴다운 구현하기
참고: 이 예제는 위젯이 있는 차트 갤러리 예제의 일부입니다.
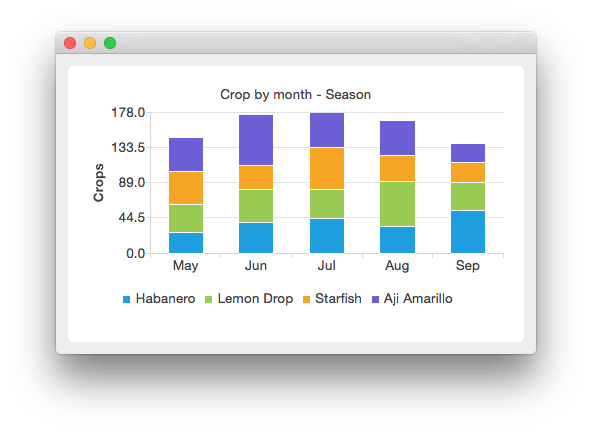
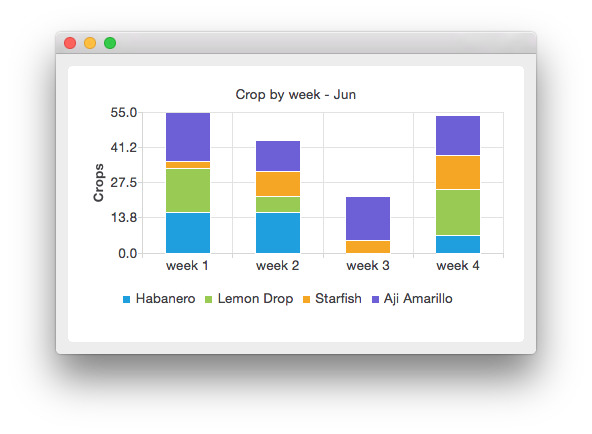
여기에서는 계절별 다양한 고추의 수확량을 보여주는 누적 막대 차트를 만듭니다. 시즌 보기에서 수확량은 월별로 그룹화됩니다. 주별 보기로 드릴다운하려면 선택한 월을 마우스 오른쪽 버튼으로 클릭합니다. 주별 보기에서는 클릭한 달의 수확량이 주별로 표시됩니다.
시즌 보기는 다음과 같습니다:

월을 클릭하면 해당 월의 수확량이 표시됩니다:

먼저 누적 막대 시리즈에 카테고리를 추가하고 카테고리를 다른 드릴다운 시리즈에 매핑하는 드릴다운 시리즈 클래스를 정의합니다. 드릴다운 시리즈의 목적은 드릴다운 구조에 대한 지식을 포함하는 것입니다. mapDrilldownSeries 함수는 카테고리를 지정된 시리즈에 매핑합니다. drilldownSeries(int category) 함수를 사용하여 카테고리에 대한 매핑을 요청할 수 있습니다.
class StackedDrilldownSeries : public QStackedBarSeries
{
    Q_OBJECT
public:
    StackedDrilldownSeries(const QStringList &categories, int maxValue, QObject *parent = nullptr);

    void mapDrilldownSeries(int index, StackedDrilldownSeries *drilldownSeries);
    StackedDrilldownSeries *drilldownSeries(int index) const;
    QStringList categories() const;
    int maxValue() const;

private:
    QMap<int, StackedDrilldownSeries *> m_drilldownSeries;
    QStringList m_categories;
    int m_maxValue = 0;
};
다음으로 마우스 클릭에 대한 핸들러를 구현하는 자체 드릴다운 차트를 정의합니다. 모든 QBarSeries 파생 클래스는 마우스로 시리즈를 클릭하면 clicked(QBarSet*, int) 신호를 보냅니다. QBarSet 매개변수에는 클릭된 막대 세트에 대한 포인터가 포함되고, int 매개변수에는 클릭된 카테고리의 인덱스가 포함됩니다.
class StackedDrilldownChart : public QChart
{
    Q_OBJECT
public:
    explicit StackedDrilldownChart(QGraphicsItem *parent = nullptr, Qt::WindowFlags wFlags = {});

    void changeSeries(StackedDrilldownSeries *series);

public slots:
    void handleClicked(int index, QBarSet *);

private:
    StackedDrilldownSeries *m_currentSeries = nullptr;
    QBarCategoryAxis *m_axisX = nullptr;
    QValueAxis *m_axisY = nullptr;
};
이제 드릴다운 클래스가 준비되었으므로 사용을 시작할 수 있습니다. 먼저 차트를 만듭니다.
auto drilldownChart = new StackedDrilldownChart;
drilldownChart->setAnimationOptions(QChart::SeriesAnimations);
드릴다운 시리즈를 구성할 카테고리를 정의합니다.
// Define categories
const QStringList months = {
    "May", "Jun", "Jul", "Aug", "Sep"
};
const QStringList weeks = {
    "week 1", "week 2", "week 3", "week 4"
};
const QStringList plants = {
    "Habanero", "Lemon Drop", "Starfish", "Aji Amarillo"
};
드릴다운 구조를 만들기 위해 먼저 seasonSeries라고 하는 최상위 수준의 시리즈를 만듭니다. seasonSeries의 각 월에 대해 해당 월에 대한 더 자세한 데이터를 포함하는 weeklySeries라는 드릴다운 시리즈를 만듭니다. weeklySeries에서 드릴다운 핸들러를 사용하여 seasonSeries로 다시 돌아옵니다. 이를 위해 시리즈에 매핑을 추가합니다. 시즌 시리즈는 각 월의 주간 시리즈에 매핑됩니다. 모든 주간 시리즈는 다시 시즌 시리즈에 매핑됩니다. 매핑이 작동하도록 하기 위해 시리즈에서 클릭된 신호를 드릴다운 차트에 연결합니다.
// Create drilldown structure
auto seasonSeries = new StackedDrilldownSeries(months, 320, drilldownChart);
seasonSeries->setName("Crop by month - Season (Click on bar to drill down)");

// Each month in season series has drilldown series for weekly data
for (int month = 0; month < months.count(); month++) {
    // Create drilldown series for every week
    auto weeklySeries = new StackedDrilldownSeries(weeks, 80, drilldownChart);
    seasonSeries->mapDrilldownSeries(month, weeklySeries);

    // Drilling down from weekly data brings us back to season data.
    for (int week = 0; week < weeks.count(); week++) {
        weeklySeries->mapDrilldownSeries(week, seasonSeries);
        weeklySeries->setName(QString("Crop by week - " + months.at(month)));
    }

    // Use clicked signal to implement drilldown
    QObject::connect(weeklySeries, &StackedDrilldownSeries::clicked,
                     drilldownChart, &StackedDrilldownChart::handleClicked);
}

// Enable drilldown from season series using clicked signal
QObject::connect(seasonSeries, &StackedDrilldownSeries::clicked,
                 drilldownChart, &StackedDrilldownChart::handleClicked);
드릴다운 구조가 준비되면 데이터를 추가할 수 있습니다. 여기에서는 각 주마다 각 공장에 대해 무작위로 작물을 생성합니다. 월별 작물은 주별 작물에서 계산되며 월별 계열의 값으로 설정됩니다.
// Fill monthly and weekly series with data
for (const QString &plant : plants) {
    auto monthlyCrop = new QBarSet(plant);
    for (int month = 0; month < months.count(); month++) {
        auto weeklyCrop = new QBarSet(plant);
        for (int week = 0; week < weeks.count(); week++)
            *weeklyCrop << QRandomGenerator::global()->bounded(20);
        // Get the drilldown series from season series and add crop to it.
        seasonSeries->drilldownSeries(month)->append(weeklyCrop);
        *monthlyCrop << weeklyCrop->sum();
    }
    seasonSeries->append(monthlyCrop);
}
여기에서는 처음에는 최상위 계열을 표시하도록 차트를 설정했습니다.
// Show season series in initial view
drilldownChart->changeSeries(seasonSeries);
drilldownChart->setTitle(seasonSeries->name());
© 2025 The Qt Company Ltd. Documentation contributions included herein are the copyrights of their respective owners. The documentation provided herein is licensed under the terms of the GNU Free Documentation License version 1.3 as published by the Free Software Foundation. Qt and respective logos are trademarks of The Qt Company Ltd. in Finland and/or other countries worldwide. All other trademarks are property of their respective owners.

