SplineSeries QML Type
以样条曲线图的形式显示数据。更多
| Import Statement: | import QtCharts 2.11 |
| In C++: | QSplineSeries |
| Inherits: |
属性
详细说明
样条曲线系列存储了QPainterPath 绘制样条曲线所需的数据点和线段控制点。当数据发生变化时,控制点会自动计算。算法会计算这些点,以便绘制法线样条线。
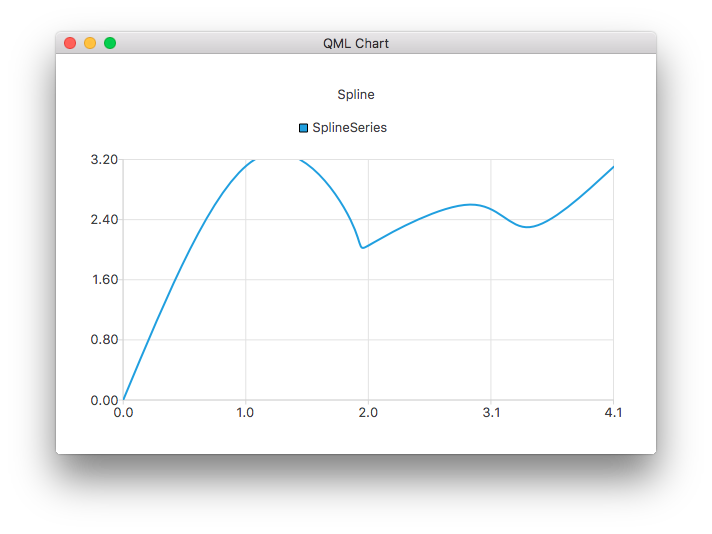
下面的 QML 代码展示了如何创建一个简单的样条线图:
ChartView {
    title: "Spline Chart"
    anchors.fill: parent
    antialiasing: true

    SplineSeries {
        name: "Spline"
        XYPoint { x: 0; y: 0.0 }
        XYPoint { x: 1.1; y: 3.2 }
        XYPoint { x: 1.9; y: 2.4 }
        XYPoint { x: 2.1; y: 2.1 }
        XYPoint { x: 2.9; y: 2.6 }
        XYPoint { x: 3.4; y: 2.3 }
        XYPoint { x: 4.1; y: 3.1 }
    }
}
属性文档
capStyle : Qt::PenCapStyle
控制线条的上限样式。设置为Qt.FlatCap 、Qt.SquareCap 或Qt.RoundCap 之一。默认情况下,线帽样式为 Qt.SquareCap。
另请参阅 Qt::PenCapStyle 。
count : int
系列中数据点的数量。
style : Qt::PenStyle
控制行的样式。设置为Qt.NoPen,Qt.SolidLine,Qt.DashLine,Qt.DotLine,Qt.DashDotLine, 或Qt.DashDotDotLine 之一。QML API 不支持使用Qt.CustomDashLine 。默认情况下,样式为 Qt.SolidLine。
另请参阅 Qt::PenStyle 。
width : real
行的宽度。默认情况下,宽度为 2.0。
© 2026 The Qt Company Ltd. Documentation contributions included herein are the copyrights of their respective owners. The documentation provided herein is licensed under the terms of the GNU Free Documentation License version 1.3 as published by the Free Software Foundation. Qt and respective logos are trademarks of The Qt Company Ltd. in Finland and/or other countries worldwide. All other trademarks are property of their respective owners.
