QPolarChart Class
QPolarChart 以极坐标图的形式显示数据。更多
| Header: | #include <QPolarChart> |
| Inherits: | QChart |
公共类型
| enum | PolarOrientation { PolarOrientationRadial, PolarOrientationAngular } |
| flags | PolarOrientations |
公共函数
| QPolarChart(QGraphicsItem *parent = nullptr, Qt::WindowFlags wFlags = Qt::WindowFlags()) | |
| virtual | ~QPolarChart() |
| void | addAxis(QAbstractAxis *axis, QPolarChart::PolarOrientation polarOrientation) |
| QList<QAbstractAxis *> | axes(QPolarChart::PolarOrientations polarOrientation = PolarOrientations(PolarOrientationRadial | PolarOrientationAngular), QAbstractSeries *series = nullptr) const |
静态公共成员
| QPolarChart::PolarOrientation | axisPolarOrientation(QAbstractAxis *axis) |
详细说明
极坐标图在圆形图表中显示数据,数据的位置基于与图表中心(极点)的角度和距离。
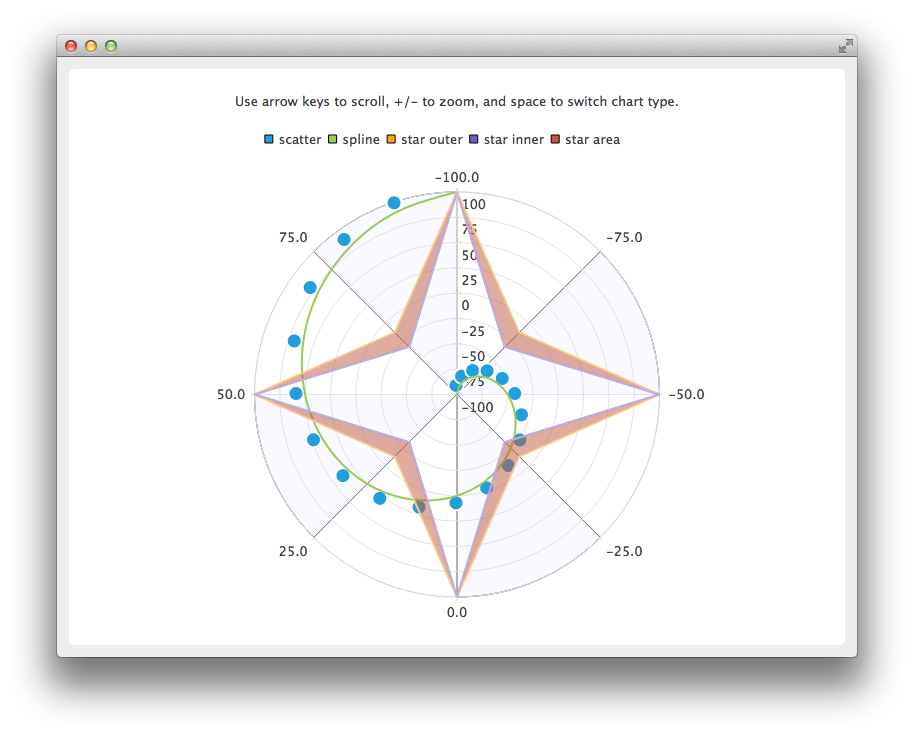
极坐标图是QChart 的一种特殊化,它支持折线、样条、面积和散点序列,以及它们所支持的所有坐标轴类型。每个坐标轴既可用作径向坐标轴,也可用作角度坐标轴。
角度QValueAxis 上的第一个和最后一个刻度线呈 0/360 度角。
如果系列中两个连续点之间的角度距离超过 180 度,则连接这两个点的任何直线都将失去意义,不会绘制。相反,将绘制一条往返于图表中心的直线。因此,在显示直线、样条线或面积序列时,必须相应地选择坐标轴范围。
极坐标图在同一位置绘制同一方向的所有坐标轴,因此使用同一方向的多个坐标轴可能会造成混乱,除非额外的坐标轴仅用于自定义网格。例如,您可以使用次要阴影QCategoryAxis 显示突出显示的范围,或使用具有隐藏标签的次要QValueAxis 提供无标签的副标题。
另请参阅 QChart 。
成员类型文档
枚举 QPolarChart::PolarOrientation
flags QPolarChart::PolarOrientations
该枚举类型指定轴的极坐标方向。
| 常量 | 值 | 描述 |
|---|---|---|
QPolarChart::PolarOrientationRadial | 0x1 | 径向轴,数值从极点开始沿图表半径放置。 |
QPolarChart::PolarOrientationAngular | 0x2 | 角度轴,数值围绕图表放置。 |
PolarOrientations 类型是QFlags<PolarOrientation> 的类型定义。它存储 PolarOrientation 值的 OR 组合。
成员函数文档
[explicit] QPolarChart::QPolarChart(QGraphicsItem *parent = nullptr, Qt::WindowFlags wFlags = Qt::WindowFlags())
构造极坐标图,作为parent 的子图。由wFlags 指定的属性将传递给QChart 构造函数。
[virtual noexcept] QPolarChart::~QPolarChart()
删除极坐标图表对象及其子对象,如添加到该对象中的系列和坐标轴对象。
void QPolarChart::addAxis(QAbstractAxis *axis, QPolarChart::PolarOrientation polarOrientation)
此方便方法将坐标轴axis 添加到极坐标图中,极坐标方向polarOrientation 。图表拥有轴的所有权。
注: 也可以使用QChart::addAxis() 将坐标轴添加到极坐标图中。指定的对齐方式决定极坐标方向:水平对齐方式表示角度轴,垂直对齐方式表示径向轴。
另请参阅 QChart::removeAxis()、QChart::createDefaultAxes()、QAbstractSeries::attachAxis() 和QChart::addAxis() 。
QList<QAbstractAxis *> QPolarChart::axes(QPolarChart::PolarOrientations polarOrientation = PolarOrientations(PolarOrientationRadial | PolarOrientationAngular), QAbstractSeries *series = nullptr) const
返回为极坐标方向polarOrientation 的系列series 添加的坐标轴。如果没有提供序列,则返回具有指定极坐标方向的任何轴。
另请参见 addAxis()。
[static] QPolarChart::PolarOrientation QPolarChart::axisPolarOrientation(QAbstractAxis *axis)
极坐标图的角坐标轴报告水平方向,径坐标轴报告垂直方向。该函数是一个方便函数,用于将axis 轴的方向转换为相应的极坐标方向。如果axis 为空或未添加到极坐标图中,返回值将毫无意义。
© 2026 The Qt Company Ltd. Documentation contributions included herein are the copyrights of their respective owners. The documentation provided herein is licensed under the terms of the GNU Free Documentation License version 1.3 as published by the Free Software Foundation. Qt and respective logos are trademarks of The Qt Company Ltd. in Finland and/or other countries worldwide. All other trademarks are property of their respective owners.
