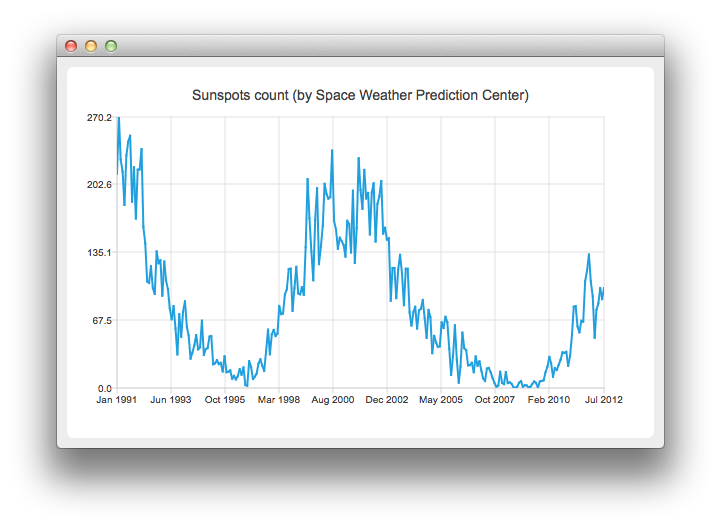
带日期和时间轴的折线图
注意: 这是 "带 Widgets 图库的图表"示例的一部分。

运行示例
运行示例 Qt Creator,打开Welcome 模式,然后从Examples 中选择示例。有关详细信息,请参阅Qt Creator: 教程:构建并运行。
创建折线图
要创建折线图,需要QLineSeries 实例。让我们创建一个。
auto series = new QLineSeries;
我们将在图表中展示太阳黑子数量随时间的变化情况。数据(来自太空天气预报中心)是从文本文件中读取的。
在下面的代码段中,请注意QDateTime::toMSecsSinceEpoch 方法是如何将QDateTime 对象转换为一个数字,并传递给QLineSeries append 方法的。
// data from http://www.swpc.noaa.gov/ftpdir/weekly/RecentIndices.txt
// http://www.swpc.noaa.gov/ftpdir/weekly/README
// http://www.weather.gov/disclaimer
QFile sunSpots(":sun_spots");
if (!sunSpots.open(QIODevice::ReadOnly | QIODevice::Text)) {
    m_loadError = QStringLiteral("Failed to load '%1' file.").arg(sunSpots.fileName());
    return false;
}

QTextStream stream(&sunSpots);
while (!stream.atEnd()) {
    QString line = stream.readLine();
    if (line.startsWith("#") || line.startsWith(":"))
        continue;
    QStringList values = line.split(QLatin1Char(' '), Qt::SkipEmptyParts);
    QDateTime momentInTime;
    momentInTime.setDate(QDate(values[0].toInt(), values[1].toInt() , 15));
    series->append(momentInTime.toMSecsSinceEpoch(), values[2].toDouble());
}
sunSpots.close();
要在图表中显示数据,我们需要QChart 实例。我们将系列添加到其中,隐藏图例,创建默认坐标轴并设置图表标题。
auto chart = new QChart;
chart->addSeries(series);
chart->legend()->hide();
chart->setTitle("Sunspots count (by Space Weather Prediction Center)");
由于我们使用的是QLineSeries ,因此调用 createDefaultAxes 将同时创建QValueAxis 作为 X 轴和 Y 轴。要使用QDateTimeAxis ,我们需要手动将其设置到图表中。首先,创建QDateTimeAxis 的实例,然后设置要显示的刻度数。太阳黑子的数量是以一个月的平均值提供的。因此,我们不需要坐标轴标签包含时间和日期信息。这可以通过设置自定义标签格式来实现。请参考QDateTime::toString() 方法文档,了解可用的格式选项。
auto axisX = new QDateTimeAxis;
axisX->setTickCount(10);
axisX->setFormat("MMM yyyy");
axisX->setTitleText("Date");
chart->addAxis(axisX, Qt::AlignBottom);
series->attachAxis(axisX);

auto axisY = new QValueAxis;
axisY->setLabelFormat("%i");
axisY->setTitleText("Sunspots count");
chart->addAxis(axisY, Qt::AlignLeft);
series->attachAxis(axisY);
然后,我们创建一个QChartView 对象,并将QChart 作为参数。这样我们就不需要自己创建QGraphicsView 场景了。我们还将反锯齿设置为开启,以使渲染的线条看起来更漂亮。
createDefaultChartView(chart);
图表就可以显示了。
© 2025 The Qt Company Ltd. Documentation contributions included herein are the copyrights of their respective owners. The documentation provided herein is licensed under the terms of the GNU Free Documentation License version 1.3 as published by the Free Software Foundation. Qt and respective logos are trademarks of The Qt Company Ltd. in Finland and/or other countries worldwide. All other trademarks are property of their respective owners.

