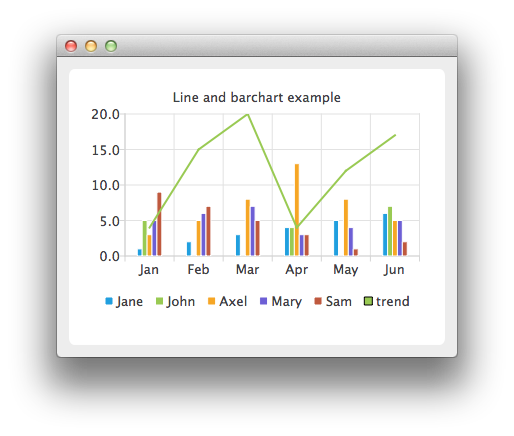
结合折线图和条形图
注: 这是 "带小工具的图表图库"示例的一部分。
在该示例中,我们将折线图与柱状图相结合,并将类别轴作为两者的共同轴。

在此,我们为条形数列创建数据。
auto set0 = new QBarSet("Jane");
auto set1 = new QBarSet("John");
auto set2 = new QBarSet("Axel");
auto set3 = new QBarSet("Mary");
auto set4 = new QBarSet("Sam");

*set0 << 1 << 2 << 3 << 4 << 5 << 6;
*set1 << 5 << 0 << 0 << 4 << 0 << 7;
*set2 << 3 << 5 << 8 << 13 << 8 << 5;
*set3 << 5 << 6 << 7 << 3 << 4 << 5;
*set4 << 9 << 7 << 5 << 3 << 1 << 2;
我们创建一个柱形数列,并为其添加数据集。每个集合的第一个值归入第一个类别,第二个值归入第二个类别,以此类推。
auto barseries = new QBarSeries;
barseries->append(set0);
barseries->append(set1);
barseries->append(set2);
barseries->append(set3);
barseries->append(set4);
然后,我们创建一个线性序列并添加数据。为了使数据与柱状图相匹配,我们使用指数作为线性序列的 x 值,这样第一个点就在(0,值),第二个点就在(1,值),以此类推。
auto lineseries = new QLineSeries;
lineseries->setName("trend");
lineseries->append(QPoint(0, 4));
lineseries->append(QPoint(1, 15));
lineseries->append(QPoint(2, 20));
lineseries->append(QPoint(3, 4));
lineseries->append(QPoint(4, 12));
lineseries->append(QPoint(5, 17));
在此,我们创建图表并添加两个系列。
auto chart = new QChart;
chart->addSeries(barseries);
chart->addSeries(lineseries);
chart->setTitle("Line and Bar Chart");
为了让图表正确显示序列,我们必须为序列创建自定义坐标轴。如果不创建自定义坐标轴,那么每个序列都将按比例使用图表的最大面积(就像在单序列情况下一样),结果将是不正确的。通过自定义坐标轴,我们可以将两个序列的范围设置为遵循同一坐标轴。对于 x 轴,我们使用QBarCategoryAxis ,对于 y 轴,我们使用 QValuesAxis。
QStringList categories;
categories << "Jan" << "Feb" << "Mar" << "Apr" << "May" << "Jun";
auto axisX = new QBarCategoryAxis;
axisX->append(categories);
chart->addAxis(axisX, Qt::AlignBottom);
lineseries->attachAxis(axisX);
barseries->attachAxis(axisX);
axisX->setRange(QString("Jan"), QString("Jun"));

auto axisY = new QValueAxis;
chart->addAxis(axisY, Qt::AlignLeft);
lineseries->attachAxis(axisY);
barseries->attachAxis(axisY);
axisY->setRange(0, 20);
我们还要显示图例。
chart->legend()->setVisible(true);
chart->legend()->setAlignment(Qt::AlignBottom);
最后,我们将图表添加到视图中。
createDefaultChartView(chart);
© 2025 The Qt Company Ltd. Documentation contributions included herein are the copyrights of their respective owners. The documentation provided herein is licensed under the terms of the GNU Free Documentation License version 1.3 as published by the Free Software Foundation. Qt and respective logos are trademarks of The Qt Company Ltd. in Finland and/or other countries worldwide. All other trademarks are property of their respective owners.

