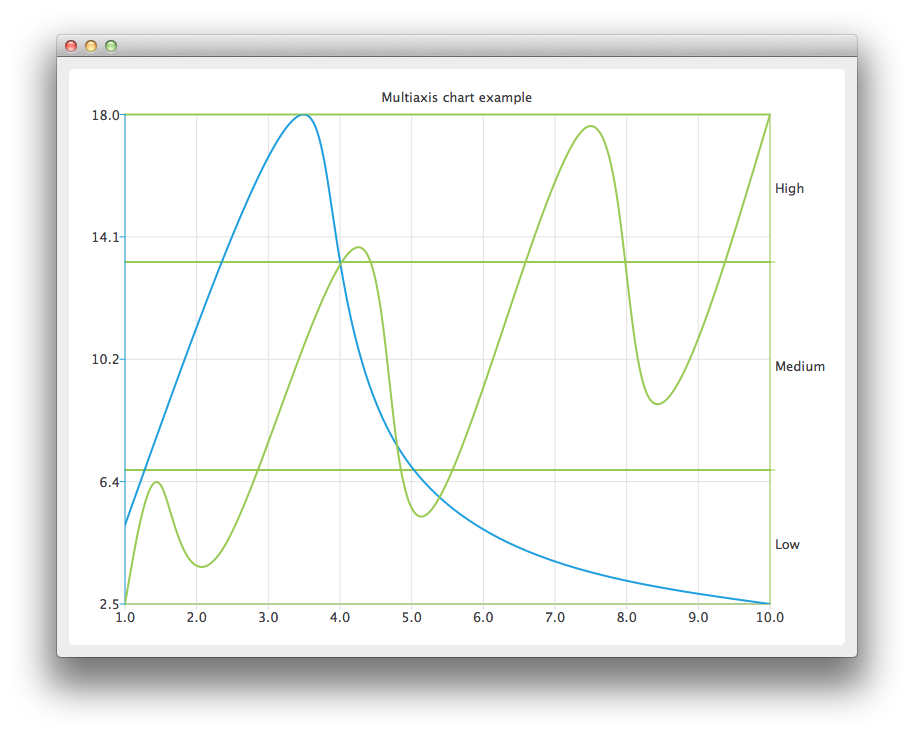
使用多坐标轴
注: 这是 "带 Widgets 图库的图表"示例的一部分。

创建QChart 实例,隐藏图表图例并设置标题。
auto chart = new QChart;
chart->legend()->hide();
chart->setTitle("Multiple Vertical Axes in Chart");
创建QValueAxis 实例,该实例将被两个系列用作水平坐标轴,并将其添加到图表底部。该坐标轴可在多个系列之间共享,但每个系列只能有一个垂直和水平坐标轴。
auto axisX = new QValueAxis;
axisX->setTickCount(10);
chart->addAxis(axisX, Qt::AlignBottom);
创建第一个系列并添加数据。最后,将系列添加到图表中。实例化自己的 Y 轴,并将其添加到图表中。然后附加通用 X 轴和系列专用 Y 轴。在本例中,坐标轴线的颜色与系列的颜色相同,以便区分哪个坐标轴连接到哪个系列。
auto series = new QSplineSeries;
*series << QPointF(1, 5) << QPointF(3.5, 18) << QPointF(4.8, 7.5) << QPointF(10, 2.5);
chart->addSeries(series);

auto axisY = new QValueAxis;
axisY->setLinePenColor(series->pen().color());

chart->addAxis(axisY, Qt::AlignLeft);
series->attachAxis(axisX);
series->attachAxis(axisY);
同样准备另一个系列。这次使用了不同的轴类型。此外,网格线的颜色也设置为与系列的颜色相同。
series = new QSplineSeries;
*series << QPointF(1, 0.5) << QPointF(1.5, 4.5) << QPointF(2.4, 2.5) << QPointF(4.3, 12.5)
        << QPointF(5.2, 3.5) << QPointF(7.4, 16.5) << QPointF(8.3, 7.5) << QPointF(10, 17);
chart->addSeries(series);

auto axisY3 = new QCategoryAxis;
axisY3->append("Low", 5);
axisY3->append("Medium", 12);
axisY3->append("High", 17);
axisY3->setLinePenColor(series->pen().color());
axisY3->setGridLinePen((series->pen()));

chart->addAxis(axisY3, Qt::AlignRight);
series->attachAxis(axisX);
series->attachAxis(axisY3);
创建QChartView 对象,参数为QChart 。
createDefaultChartView(chart);
© 2025 The Qt Company Ltd. Documentation contributions included herein are the copyrights of their respective owners. The documentation provided herein is licensed under the terms of the GNU Free Documentation License version 1.3 as published by the Free Software Foundation. Qt and respective logos are trademarks of The Qt Company Ltd. in Finland and/or other countries worldwide. All other trademarks are property of their respective owners.

