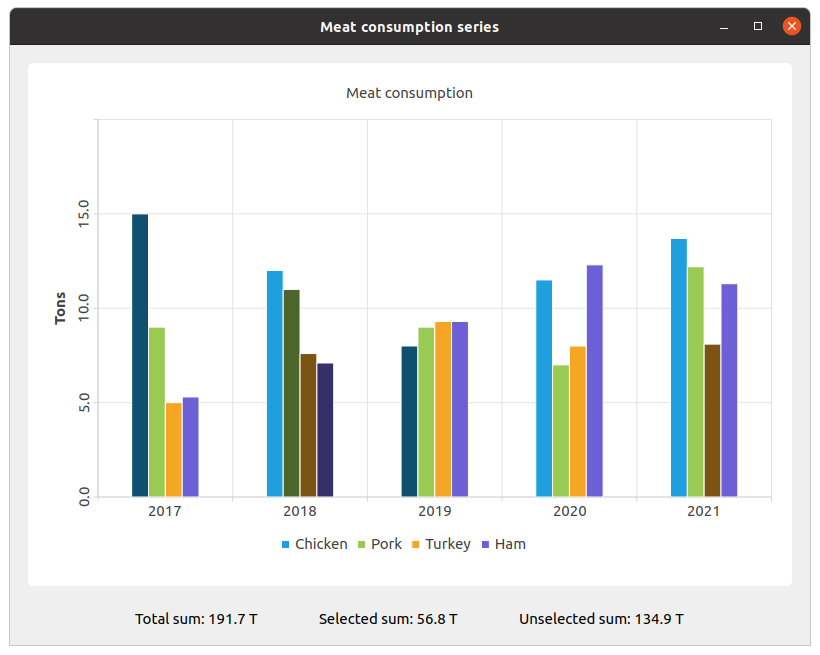
更改条形图的颜色和状态
注: 这是带 Widgets 图库的图表示例的一部分。
该示例展示了如何使用 setBarSelected() 更改条形图的颜色和状态。

我们先创建集合并填充数据。然后创建系列并添加数据。
QBarSet *setChicken = createChickenSet();
QBarSet *setPork = createPorkSet();
QBarSet *setTurkey = createTurkeySet();
QBarSet *setHam = createHamSet();
qreal totalSum = setChicken->sum() + setPork->sum() + setTurkey->sum() + setHam->sum();
QList<QBarSet *> setList = QList<QBarSet *>{setChicken, setPork, setTurkey, setHam};

auto series = new QBarSeries;
series->append(setList);
创建图表并添加系列。此外,我们还为图表添加标题,为图表设置动画,并对齐图例。
auto chart = new QChart;
chart->addSeries(series);
chart->setTitle(tr("Meat Consumption (Click on bars to select them)"));
chart->setAnimationOptions(QChart::SeriesAnimations);
chart->legend()->setVisible(true);
chart->legend()->setAlignment(Qt::AlignBottom);
chart->layout()->setContentsMargins(0, 0, 0, 0);
在此,我们为选定的柱形图设置颜色。
const auto barSets = series->barSets();
for (QBarSet *barSet : barSets)
    barSet->setSelectedColor(barSet->brush().color().darker());
下一步是添加坐标轴:QBarCategoryAxis 表示测量年份,QValueAxis 表示数值范围。
QStringList categories = createYearCategories();
auto axisX = new QBarCategoryAxis;
axisX->setCategories(categories);
chart->addAxis(axisX, Qt::AlignBottom);
series->attachAxis(axisX);

auto axisY = new QValueAxis;
axisY->setRange(0, 20);
axisY->setTitleText(tr("Tons"));
axisY->setLabelsAngle(-90);
axisY->setTitleVisible(true);
chart->addAxis(axisY, Qt::AlignLeft);
series->attachAxis(axisY);
然后添加图表视图,将图表放入其中。
auto chartView = new QChartView(chart, this);
chartView->setRenderHint(QPainter::Antialiasing);
在此,我们为选定和未选定条形图的数值标签创建一个部件。
auto labelWidget = new QWidget(this);
auto labelLayout = new QHBoxLayout(labelWidget);
labelLayout->setAlignment(Qt::AlignCenter);

auto totalSumLabel = new QLabel(tr("Total sum: %1 T").arg(totalSum), this);
labelLayout->addWidget(totalSumLabel);
totalSumLabel->setContentsMargins(0, 0, 54, 0);

auto selectedSumLabel = new QLabel(tr("Selected sum: 0 T"), this);
labelLayout->addWidget(selectedSumLabel);

auto unselectedSumLabel = new QLabel(tr("Unselected sum: %1 T").arg(totalSum), this);
labelLayout->addWidget(unselectedSumLabel);
unselectedSumLabel->setContentsMargins(54, 0, 0, 0);
我们使用 lambda 将选择特定条形图与数值标签连接起来。set->toggleSelection({index}) 设置所选条形图。
QObject::connect(series, &QAbstractBarSeries::clicked, series, [=](int index, QBarSet *set) {
    set->toggleSelection({index});
    qreal selectedSum = 0.;
    for (int i = 0; i < setList.size(); ++i) {
        auto selectedIndices = setList.at(i)->selectedBars();
        for (int k = 0; k < selectedIndices.size(); ++k)
            selectedSum += setList.at(i)->at(selectedIndices.at(k));
    }
    selectedSumLabel->setText(tr("Selected sum: %1 T").arg(selectedSum));
    // Because of rounding errors, selectedSum can result in being bigger than total sum
    qreal unselectedSum = totalSum - selectedSum < 0 ? 0. : totalSum - selectedSum;
    unselectedSumLabel->setText(
        tr("Unselected sum: %1 T")
            .arg(unselectedSum)
        );
});
最后,我们创建主布局。
auto mainLayout = new QVBoxLayout(this);

mainLayout->addWidget(chartView);
mainLayout->addWidget(labelWidget);
© 2025 The Qt Company Ltd. Documentation contributions included herein are the copyrights of their respective owners. The documentation provided herein is licensed under the terms of the GNU Free Documentation License version 1.3 as published by the Free Software Foundation. Qt and respective logos are trademarks of The Qt Company Ltd. in Finland and/or other countries worldwide. All other trademarks are property of their respective owners.

