轴处理
使用 QML 中的自定义输入处理程序实现轴拖动,并创建自定义轴格式化器。
轴处理演示了两种不同的自定义轴功能。这些功能在应用程序中有自己的选项卡。
以下章节只集中介绍这些功能,而跳过对基本功能的解释--如需更详细的 QML 示例文档,请参阅《简单散点图》(Simple Scatter Graph)。
运行示例
运行示例 Qt Creator,打开Welcome 模式,并从Examples 选择示例。更多信息,请参阅Qt Creator: Tutorial:构建并运行。
轴拖动
在Axis Dragging 标签页,在 QML 中实现一个自定义输入处理程序,使您能拖动轴标签以更改轴范围。此外,还可使用正投影和动态更新自定义项的属性。
覆盖默认输入处理程序
要停用默认输入处理机制,请取消Scatter3D 的默认输入处理程序:
unsetDefaultInputHandler();
...然后,添加一个MouseArea 并将其设置为填充父项,也就是我们的scatterGraph 所包含的Item 。同时,将其设置为只接受鼠标左键的按压,因为在本例中不需要其他按钮:
MouseArea {
    anchors.fill: parent
    hoverEnabled: true
    acceptedButtons: Qt.LeftButton
    ...
然后,监听鼠标按下,捕捉到后向图形发送选择查询:
onPressed: (mouse)=> {
               scatterGraph.doPicking(Qt.point(mouse.x, mouse.y));
           }
onPositionChanged 信号处理器会捕捉当前的鼠标位置,这是计算移动距离所必需的:
onPositionChanged: (mouse)=> {
                       currentMouseX = mouse.x;
                       currentMouseY = mouse.y;
    ...
在onPositionChanged 结束时,保存之前的鼠标位置,用于稍后介绍的移动距离计算:
...
    previousMouseX = currentMouseX;
    previousMouseY = currentMouseY;
}
将鼠标移动转换为轴范围变化
在scatterGraph 中,监听onSelectedElementChanged 。在inputArea 的onPressed 中进行选择查询后发出信号。将元素类型设置为您在主组件中定义的属性 (property int selectedAxisLabel: -1),因为它是您感兴趣的类型:
onSelectedElementChanged: {
    if (selectedElement >= Graphs3D.ElementType.AxisXLabel
            && selectedElement <= Graphs3D.ElementType.AxisZLabel) {
        selectedAxisLabel = selectedElement;
    } else {
        selectedAxisLabel = -1;
    }
}
然后,回到onPositionChanged 的inputArea ,检查是否有鼠标按键被按下,是否有当前轴标签选择。如果条件满足,则调用将鼠标移动转换为轴范围更新的函数:
...
if (pressed && selectedAxisLabel != -1)
    axisDragView.dragAxis();
...
在这种情况下转换很容易,因为摄像机的旋转是固定的。您可以使用一些预先计算的值,计算鼠标移动距离,并将这些值应用到选定的轴范围:
function dragAxis() {
    // Do nothing if previous mouse position is uninitialized
    if (previousMouseX === -1)
        return;

    // Directional drag multipliers based on rotation. Camera is locked to 45 degrees, so we
    // can use one precalculated value instead of calculating xx, xy, zx and zy individually
    var cameraMultiplier = 0.70710678;

    // Calculate the mouse move amount
    var moveX = currentMouseX - previousMouseX;
    var moveY = currentMouseY - previousMouseY;

    // Adjust axes
    switch (selectedAxisLabel) {
    case Graphs3D.ElementType.AxisXLabel:
        var distance = ((moveX - moveY) * cameraMultiplier) / dragSpeedModifier;
        // Check if we need to change min or max first to avoid invalid ranges
        if (distance > 0) {
            scatterGraph.axisX.min -= distance;
            scatterGraph.axisX.max -= distance;
        } else {
            scatterGraph.axisX.max -= distance;
            scatterGraph.axisX.min -= distance;
        }
        break;
    case Graphs3D.ElementType.AxisYLabel:
        distance = moveY / dragSpeedModifier;
        // Check if we need to change min or max first to avoid invalid ranges
        if (distance > 0) {
            scatterGraph.axisY.max += distance;
            scatterGraph.axisY.min += distance;
        } else {
            scatterGraph.axisY.min += distance;
            scatterGraph.axisY.max += distance;
        }
        break;
    case Graphs3D.ElementType.AxisZLabel:
        distance = ((moveX + moveY) * cameraMultiplier) / dragSpeedModifier;
        // Check if we need to change min or max first to avoid invalid ranges
        if (distance > 0) {
            scatterGraph.axisZ.max += distance;
            scatterGraph.axisZ.min += distance;
        } else {
            scatterGraph.axisZ.min += distance;
            scatterGraph.axisZ.max += distance;
        }
        break;
    }
}
有关从鼠标移动到坐标轴范围更新的更复杂转换,请参阅图形库。
其他功能
该示例还演示了如何使用正投影以及如何即时更新自定义项的属性。
正投影非常简单。您只需更改scatterGraph 的orthoProjection 属性即可。示例中有一个按钮用于打开或关闭正投影:
Button {
    id: orthoToggle
    width: axisDragView.portraitMode ? parent.width : parent.width / 3
    text: "Display Orthographic"
    anchors.left: axisDragView.portraitMode ? parent.left : rangeToggle.right
    anchors.top: axisDragView.portraitMode ? rangeToggle.bottom : parent.top
    onClicked: {
        if (scatterGraph.orthoProjection) {
            text = "Display Orthographic";
            scatterGraph.orthoProjection = false;
            // Orthographic projection disables shadows, so we need to switch them back on
            scatterGraph.shadowQuality = Graphs3D.ShadowQuality.Medium
        } else {
            text = "Display Perspective";
            scatterGraph.orthoProjection = true;
        }
    }
}
对于自定义项目,请在customItemList 的scatterGraph 中添加一个:
customItemList: [
    Custom3DItem {
        id: qtCube
        meshFile: ":/qml/axishandling/cube.mesh"
        textureFile: ":/qml/axishandling/cubetexture.png"
        position: Qt.vector3d(0.65, 0.35, 0.65)
        scaling: Qt.vector3d(0.3, 0.3, 0.3)
    }
]
您可以使用一个定时器来添加、删除和旋转图表中的所有项目,并使用相同的定时器来旋转自定义项目:
onTriggered: {
    rotationAngle = rotationAngle + 1;
    qtCube.setRotationAxisAndAngle(Qt.vector3d(1, 0, 1), rotationAngle);
    ...
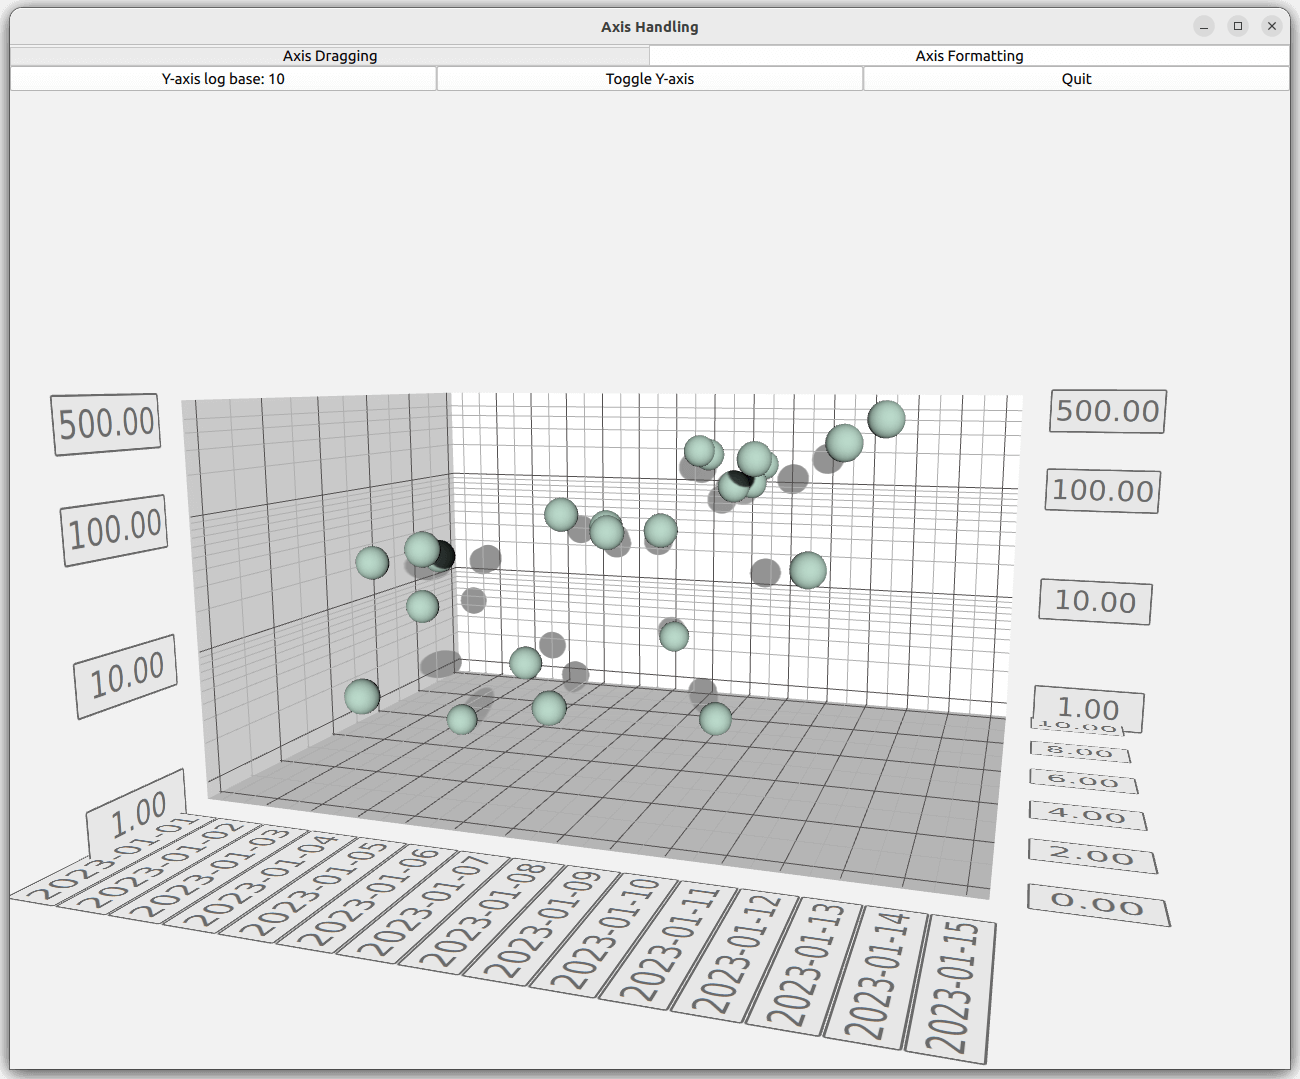
轴格式化器
在Axis Formatter 选项卡中,创建自定义轴格式化器。它还说明了如何使用预定义轴格式器。
自定义轴格式器
自定义轴格式化器需要子类化QValue3DAxisFormatter ,这不能单独在 QML 代码中完成。在本例中,坐标轴将浮点值解释为时间戳,并在坐标轴标签中显示日期。为此,引入一个名为CustomFormatter 的新类,它是QValue3DAxisFormatter 的子类:
class CustomFormatter : public QValue3DAxisFormatter
{
...
由于数据宽度不同,QScatter3DSeries 的浮点值无法直接转换为QDateTime 值,因此需要在两者之间进行某种映射。要进行映射,需要为格式器指定一个原始日期,并将QScatter3DSeries 中的浮点数值解释为该原始值的日期偏移量。原始日期作为属性给出:
Q_PROPERTY(QDate originDate READ originDate WRITE setOriginDate NOTIFY originDateChanged)对于从值到QDateTime 的映射,请使用valueToDateTime() 方法:
QDateTime CustomFormatter::valueToDateTime(qreal value) const
{
    return m_originDate.startOfDay().addMSecs(qint64(oneDayMs * value));
}
为实现轴格式化功能,CustomFormatter 需要重新实现一些虚拟方法:
QValue3DAxisFormatter *createNewInstance() const override; void populateCopy(QValue3DAxisFormatter ©) override; void recalculate() override; QString stringForValue(qreal value, const QString &format) override;
前两个方法很简单,只需创建CustomFormatter 的新实例,并将必要的数据复制到其中即可。使用这两个方法可以创建和更新用于渲染的格式器缓存。切记要调用populateCopy() 的超类实现:
QValue3DAxisFormatter *CustomFormatter::createNewInstance() const { return new CustomFormatter(); } void CustomFormatter::populateCopy(QValue3DAxisFormatter ©) { QValue3DAxisFormatter::populateCopy(copy); CustomFormatter *customFormatter = static_cast<CustomFormatter *>(©); customFormatter->m_originDate = m_originDate; customFormatter->m_selectionFormat = m_selectionFormat; }
CustomFormatter 在recalculate() 方法中,格式器完成了大部分工作,计算网格、子网格和标签位置,并格式化标签字符串。在自定义格式器中,忽略轴的线段数,并始终在午夜时分绘制网格线。子网格段计数和标签定位将正常处理:
void CustomFormatter::recalculate()
{
    // We want our axis to always have gridlines at date breaks

    // Convert range into QDateTimes
    QDateTime minTime = valueToDateTime(qreal(axis()->min()));
    QDateTime maxTime = valueToDateTime(qreal(axis()->max()));

    // Find out the grid counts
    QTime midnight(0, 0);
    QDateTime minFullDate(minTime.date(), midnight);
    int gridCount = 0;
    if (minFullDate != minTime)
        minFullDate = minFullDate.addDays(1);
    QDateTime maxFullDate(maxTime.date(), midnight);

    gridCount += minFullDate.daysTo(maxFullDate) + 1;
    int subGridCount = axis()->subSegmentCount() - 1;

    QList<float> gridPositions;
    QList<float> subGridPositions;
    QList<float> labelPositions;
    QStringList labelStrings;

    // Reserve space for position arrays and label strings
    gridPositions.resize(gridCount);
    subGridPositions.resize((gridCount + 1) * subGridCount);
    labelPositions.resize(gridCount);
    labelStrings.reserve(gridCount);

    // Calculate positions and format labels
    qint64 startMs = minTime.toMSecsSinceEpoch();
    qint64 endMs = maxTime.toMSecsSinceEpoch();
    qreal dateNormalizer = endMs - startMs;
    qreal firstLineOffset = (minFullDate.toMSecsSinceEpoch() - startMs) / dateNormalizer;
    qreal segmentStep = oneDayMs / dateNormalizer;
    qreal subSegmentStep = 0;
    if (subGridCount > 0)
        subSegmentStep = segmentStep / qreal(subGridCount + 1);

    for (int i = 0; i < gridCount; i++) {
        qreal gridValue = firstLineOffset + (segmentStep * qreal(i));
        gridPositions[i] = float(gridValue);
        labelPositions[i] = float(gridValue);
        labelStrings << minFullDate.addDays(i).toString(axis()->labelFormat());
    }

    for (int i = 0; i <= gridCount; i++) {
        if (subGridPositions.size()) {
            for (int j = 0; j < subGridCount; j++) {
                float position;
                if (i)
                    position = gridPositions.at(i - 1) + subSegmentStep * (j + 1);
                else
                    position = gridPositions.at(0) - segmentStep + subSegmentStep * (j + 1);
                if (position > 1.0f || position < 0.0f)
                    position = gridPositions.at(0);
                subGridPositions[i * subGridCount + j] = position;
            }
        }
    }
    setGridPoitions(gridPositions);
    setSubGridPositions(subGridPositions);
    setlabelPositions(labelPositions);
    setLabelStrings(labelStrings);
}
坐标轴标签的格式只显示日期。不过,要提高选择标签时间戳的分辨率,可为自定义格式器指定另一个属性,以便用户自定义:
Q_PROPERTY(QString selectionFormat READ selectionFormat WRITE setSelectionFormat NOTIFY
selectionFormatChanged)该选择格式属性用于重新实现的stringToValue 方法,在该方法中,提交的格式将被忽略,而自定义选择格式将取而代之:
QString CustomFormatter::stringForValue(qreal value, const QString &format)
{
    Q_UNUSED(format);

    return valueToDateTime(value).toString(m_selectionFormat);
}
要把我们新的自定义格式器展示给 QML,需要声明它并把它变成一个 QML 模块。有关如何操作的信息,请参阅Surface Graph Gallery。
QML
在 QML 代码中,为每个维度定义不同的轴:
axisZ: valueAxis
axisY: logAxis
axisX: dateAxis
Z 轴只是一个常规的Value3DAxis :
Value3DAxis {
    id: valueAxis
    segmentCount: 5
    subSegmentCount: 2
    labelFormat: "%.2f"
    min: 0
    max: 10
}
对于 Y 轴,定义一个对数轴。要使Value3DAxis 显示对数刻度,请为轴的formatter 属性指定LogValue3DAxisFormatter :
Value3DAxis {
    id: logAxis
    formatter: LogValue3DAxisFormatter {
        id: logAxisFormatter
        base: 10
        autoSubGrid: true
        edgeLabelsVisible: true
    }
    labelFormat: "%.2f"
}
最后,在 X 轴上使用新的CustomFormatter :
Value3DAxis {
    id: dateAxis
    formatter: CustomFormatter {
        originDate: "2023-01-01"
        selectionFormat: "yyyy-MM-dd HH:mm:ss"
    }
    subSegmentCount: 2
    labelFormat: "yyyy-MM-dd"
    min: 0
    max: 14
}
应用程序的其余部分包括修改坐标轴和显示图形的逻辑,非常容易理解。
示例内容
© 2026 The Qt Company Ltd. Documentation contributions included herein are the copyrights of their respective owners. The documentation provided herein is licensed under the terms of the GNU Free Documentation License version 1.3 as published by the Free Software Foundation. Qt and respective logos are trademarks of The Qt Company Ltd. in Finland and/or other countries worldwide. All other trademarks are property of their respective owners.
