
图表图库
条形图、散点图和表面图的图库。
“图表图库”展示了这三种图表类型及其部分特殊功能。这些图表在应用程序中各有独立的标签页。
运行示例
您可以通过以下方式运行示例:
- Qt Creator
打开Welcome 模式,并从Examples 中选择该示例。有关更多信息,请参阅Qt Creator :教程:构建与运行。
- Qt Extension for Visual Studio Code
在Command Palette 中运行Qt: Open Qt examples 命令,并从列表中选择该示例。有关更多信息,请参阅Qt Extension for Visual Studio Code :教程:构建和运行。
条形图
在“Bar Graph ”选项卡中,使用 Q3DBarWidgetItem 创建一个 3D 条形图,并结合使用各种控件来调整条形图的各项属性。该示例演示了如何:
- 使用 Q3DBarWidgetItem 及若干控件小部件创建应用程序
- 使用QBar3DSeries 和QBarDataProxy 向图表设置数据
- 使用控件调整某些图表和数据序列的属性
- 通过点击坐标轴标签来选择行或列
- 创建一个自定义代理以配合 Q3DBarWidgetItem 使用
有关与图表交互的详细信息,请参阅此页面。
创建应用程序
- 在
bargraph.cpp中,实例化QQuickWidget 和Q3DBarsWidgetItem ,并将QQuickWidget 实例设置为Q3DBarsWidgetItem 的小部件:m_quickWidget = new QQuickWidget(); m_barGraph = new Q3DBarsWidgetItem(this); m_barGraph->setWidget(m_quickWidget); - 创建一个容器控件,以及水平和垂直布局。将图表和垂直布局添加到水平布局中:
m_container = new QWidget(); auto *hLayout = new QHBoxLayout(m_container); QSize screenSize = m_quickWidget->screen()->size(); m_quickWidget->setMinimumSize(QSize(screenSize.width() / 2, screenSize.height() / 1.75)); m_quickWidget->setMaximumSize(screenSize); m_quickWidget->setSizePolicy(QSizePolicy::Expanding, QSizePolicy::Expanding); m_quickWidget->setFocusPolicy(Qt::StrongFocus); hLayout->addWidget(m_quickWidget, 1); auto *vLayout = new QVBoxLayout(); hLayout->addLayout(vLayout); - 创建另一个类来处理数据的添加以及与图表的其他交互:
m_modifier = new GraphModifier(m_barGraph, this);
设置条形图
- 在
GraphModifier类的构造函数中设置图表:GraphModifier::GraphModifier(Q3DBarsWidgetItem *bargraph, QObject *parent) : QObject(parent) , m_graph(bargraph) - 将坐标轴和数据系列设为成员变量,以便支持对其进行修改:
, m_temperatureAxis(new QValue3DAxis) , m_yearAxis(new QCategory3DAxis) , m_monthAxis(new QCategory3DAxis) , m_primarySeries(new QBar3DSeries) , m_secondarySeries(new QBar3DSeries) - 为图表设置一些视觉属性:
m_graph->setShadowQuality(QtGraphs3D::ShadowQuality::SoftMedium); m_graph->setMultiSeriesUniform(true); // These are set through the active theme m_graph->activeTheme()->setPlotAreaBackgroundVisible(false); m_graph->activeTheme()->setLabelFont(QFont("Times New Roman", m_fontSize)); m_graph->activeTheme()->setLabelBackgroundVisible(true); - 设置坐标轴并将其设为图表的当前坐标轴:
m_temperatureAxis->setTitle("Average temperature"); m_temperatureAxis->setSegmentCount(m_segments); m_temperatureAxis->setSubSegmentCount(m_subSegments); m_temperatureAxis->setRange(m_minval, m_maxval); m_temperatureAxis->setLabelFormat(u"%.1f "_s + m_celsiusString); m_temperatureAxis->setLabelAutoAngle(30.0f); m_temperatureAxis->setTitleVisible(true); m_yearAxis->setTitle("Year"); m_yearAxis->setLabelAutoAngle(30.0f); m_yearAxis->setTitleVisible(true); m_monthAxis->setTitle("Month"); m_monthAxis->setLabelAutoAngle(30.0f); m_monthAxis->setTitleVisible(true); m_graph->setValueAxis(m_temperatureAxis); m_graph->setRowAxis(m_yearAxis); m_graph->setColumnAxis(m_monthAxis); - 为坐标轴标签设置一个较小的自动旋转角度:
m_yearAxis->setLabelAutoAngle(30.0f);这样做是为了使坐标轴略微朝向摄像机,从而在极端摄像机角度下提高坐标轴标签的可读性。
- 初始化数据系列的可视化属性。请注意,第二个数据系列初始状态下不可见:
m_primarySeries->setItemLabelFormat(u"Oulu - @colLabel @rowLabel: @valueLabel"_s); m_primarySeries->setMesh(QAbstract3DSeries::Mesh::BevelBar); m_primarySeries->setMeshSmooth(false); m_secondarySeries->setItemLabelFormat(u"Helsinki - @colLabel @rowLabel: @valueLabel"_s); m_secondarySeries->setMesh(QAbstract3DSeries::Mesh::BevelBar); m_secondarySeries->setMeshSmooth(false); m_secondarySeries->setVisible(false); - 将数据系列添加到图表中:
m_graph->addSeries(m_primarySeries); m_graph->addSeries(m_secondarySeries); - 通过调用与用户界面中“更改摄像机角度”按钮相同的方法来设置摄像机角度,该方法用于在各种摄像机角度之间循环切换:
changePresetCamera(); - 将新的摄像机预设应用到图形中:
static int preset = int(QtGraphs3D::CameraPreset::Front);

m_graph->setCameraPreset((QtGraphs3D::CameraPreset) preset);

if (++preset > int(QtGraphs3D::CameraPreset::DirectlyBelow))
    preset = int(QtGraphs3D::CameraPreset::FrontLow);
向图表添加数据
在构造函数末尾,调用一个用于设置数据的方法:
resetTemperatureData();该方法通过两个数组的代理将数据添加到相应的数组中:
// Set up data
static const float tempOulu[8][12] = {
    {-7.4f, -2.4f, 0.0f, 3.0f, 8.2f, 11.6f, 14.7f, 15.4f, 11.4f, 4.2f, 2.1f, -2.3f},     // 2015
    {-13.4f, -3.9f, -1.8f, 3.1f, 10.6f, 13.7f, 17.8f, 13.6f, 10.7f, 3.5f, -3.1f, -4.2f}, // 2016
...
QBarDataArray dataSet;
QBarDataArray dataSet2;

dataSet.reserve(m_years.size());
for (qsizetype year = 0; year < m_years.size(); ++year) {
    // Create a data row
    QBarDataRow dataRow(m_months.size());
    QBarDataRow dataRow2(m_months.size());
    for (qsizetype month = 0; month < m_months.size(); ++month) {
        // Add data to the row
        dataRow[month].setValue(tempOulu[year][month]);
        dataRow2[month].setValue(tempHelsinki[year][month]);
    }
    // Add the row to the set
    dataSet.append(dataRow);
    dataSet2.append(dataRow2);
}

// Add data to the data proxy (the data proxy assumes ownership of it)
m_primarySeries->dataProxy()->resetArray(dataSet, m_years, m_months);
m_secondarySeries->dataProxy()->resetArray(dataSet2, m_years, m_months);
使用控件控制图表
接下来,在bargraph.cpp 中添加一些控件。
- 添加一个滑块:
- 使用滑块来旋转图表,而不仅仅是使用鼠标或触摸操作。将其添加到垂直布局中:
- 将其连接到
GraphModifier中的一个方法: - 在
GraphModifier中创建一个插槽以连接信号。指定相机在围绕中心点的轨道上的实际位置,而不是指定预设的相机角度:void GraphModifier::rotateX(int angle) { m_xRotation = angle; m_graph->setCameraPosition(m_xRotation, m_yRotation); }
现在您可以使用滑块来旋转图形。
在垂直布局中添加更多控件以控制:
- 图形旋转
- 标签样式
- 相机预设
- 背景可见性
- 网格可见性
- 条形阴影平滑度
- 第二个柱形系列是否显示
- 数值轴方向
- 坐标轴标题的可见性与旋转
- 要显示的数据范围
- 条形样式
- 选择模式
- 主题
- 阴影质量
- 字体
- 字体大小
- 坐标轴标签旋转
- 数据模式
在“Custom Proxy Data ”数据模式下,某些控件会被有意禁用。
通过单击坐标轴标签选择行或列
通过坐标轴标签进行选择是条形图的默认功能。例如,您可以通过以下方式点击坐标轴标签来选择行:
- 将选择模式更改为
Row - 单击年份标签
- 包含所点击年份的行被选中
只要同时设置了Row 或Column ,该方法同样适用于Slice 和Item 标志。
缩放至选定区域
作为调整视图目标的一个示例,实现通过按键触发“放大至选定区域”的动画效果。动画的初始化在构造函数中完成:
m_defaultAngleX = m_graph->cameraXRotation();
m_defaultAngleY = m_graph->cameraYRotation();
m_defaultZoom = m_graph->cameraZoomLevel();
m_defaultTarget = m_graph->cameraTargetPosition();

m_animationCameraX.setTargetObject(m_graph);
m_animationCameraY.setTargetObject(m_graph);
m_animationCameraZoom.setTargetObject(m_graph);
m_animationCameraTarget.setTargetObject(m_graph);

m_animationCameraX.setPropertyName("cameraXRotation");
m_animationCameraY.setPropertyName("cameraYRotation");
m_animationCameraZoom.setPropertyName("cameraZoomLevel");
m_animationCameraTarget.setPropertyName("cameraTargetPosition");

int duration = 1700;
m_animationCameraX.setDuration(duration);
m_animationCameraY.setDuration(duration);
m_animationCameraZoom.setDuration(duration);
m_animationCameraTarget.setDuration(duration);

// The zoom always first zooms out above the graph and then zooms in
qreal zoomOutFraction = 0.3;
m_animationCameraX.setKeyValueAt(zoomOutFraction, QVariant::fromValue(0.0f));
m_animationCameraY.setKeyValueAt(zoomOutFraction, QVariant::fromValue(90.0f));
m_animationCameraZoom.setKeyValueAt(zoomOutFraction, QVariant::fromValue(50.0f));
m_animationCameraTarget.setKeyValueAt(zoomOutFraction,
QVariant::fromValue(QVector3D(0.0f, 0.0f, 0.0f)));函数GraphModifier::zoomToSelectedBar() 包含缩放功能。QPropertyAnimation 通过m_animationCameraTarget 定位到cameraTargetPosition 属性,该属性接受一个归一化到 (-1, 1) 范围内的值。
确定所选条形相对于坐标轴的位置,并将该位置用作 `m_animationCameraTarget` 的终点值:
QVector3D endTarget;
float xMin = m_graph->columnAxis()->min();
float xRange = m_graph->columnAxis()->max() - xMin;
float zMin = m_graph->rowAxis()->min();
float zRange = m_graph->rowAxis()->max() - zMin;
endTarget.setX((selectedBar.y() - xMin) / xRange * 2.0f - 1.0f);
endTarget.setZ((selectedBar.x() - zMin) / zRange * 2.0f - 1.0f);
...
m_animationCameraTarget.setEndValue(QVariant::fromValue(endTarget));
然后,旋转摄像机,使其在动画结束时始终大致指向图表的中心:
qreal endAngleX = 90.0 - qRadiansToDegrees(qAtan(qreal(endTarget.z() / endTarget.x())));
if (endTarget.x() > 0.0f)
    endAngleX -= 180.0f;
float barValue = m_graph->selectedSeries()
                     ->dataProxy()
                     ->itemAt(selectedBar.x(), selectedBar.y())
                     .value();
float endAngleY = barValue >= 0.0f ? 30.0f : -30.0f;
if (m_graph->valueAxis()->reversed())
    endAngleY *= -1.0f;
数据模型代理
当您开启Model Proxy Data 的数据模式时,示例中的图表将使用基于项模型的数据集及相应的代理。
RainfallData
RainfallData 类会同时设置QItemModelBarDataProxy 、数据系列和坐标轴。
- 我们使用
std::array<double, 12>来存储按月索引的年度数据值。静态辅助函数readData()读取数据,并返回按年份索引的QList :usingYearlyData=std::array<double, 12>; usingModelData=QList<YearlyData>; staticModelData readData(constQString&fileName, int *firstYear) { ModelData result; *firstYear =-1; // 将数据文件中的数据读入数据项列表 QFile dataFile(fileName); if(!dataFile.open(QIODevice::ReadOnly|QIODevice::Text)) { qWarning() << "Unable to open data file:" << dataFile.fileName() << dataFile.errorString(); returnresult; } QTextStream stream(&dataFile); intlastYear=-1; while(!stream.atEnd()) { QString line=stream.readLine(); if(line.startsWith(u'#'))// 忽略注释 continue; const autostrList=QStringView{line}.split(',',Qt::SkipEmptyParts); // 每行包含三个数据项:年、月和降雨量 if(strList.size()< 3) { qWarning() << "Invalid row read from data:" << line; continue; } // 将年和月存储为 int 类型,将降雨量值存储为 double 类型 boolyearOk{}; boolmonthOk{}; boolvalueOk{}; const intyear=strList.at(0).trimmed().toInt(&yearOk); const intmonth=strList.at(1).trimmed().toInt(&monthOk); const doublevalue=strList.at(2).trimmed().toDouble(&valueOk); if(!yearOk|| !monthOk||month< 1||month> 12|| !valueOk) { qWarning() << "Invalid row values:" << line; 继续; } if(year!=lastYear) { if(lastYear==-1) { *firstYear =year; }else if(year!=lastYear+ 1) { qWarning() << "Non-consecutive years" << year << lastYear; return{}; } lastYear=year; result.emplace_back(YearlyData{0, 0, 0, 0, 0, 0, 0, 0, 0, 0, 0, 0}); } result.back()[month- 1] =value; } returnresult; } ... - QList 表示一个以年和月为索引的二维数组。基于此,我们初始化一个QRangeModel 对象,并将其传递给
RainfallData类中的 QItemModelBarDataProxy():int firstYear{}; auto data = readData(":/data/raindata.txt"_L1, &firstYear); Q_ASSERT(!data.isEmpty()); updateYearsList(firstYear, firstYear + int(data.size()) - 1); auto *model = new QRangeModel(data, this); m_proxy = new QItemModelBarDataProxy(model); m_proxy->setUseModelCategories(true); m_series = new QBar3DSeries(m_proxy); - 最后,添加一个函数来获取已创建的系列以便显示:
QBar3DSeries *customSeries() { return m_series; }
散点图
在“Scatter Graph ”选项卡中,使用Q3DScatterWidgetItem 创建一个 3D 散点图。该示例演示了如何:
- 设置Q3DScatterWidgetItem 图表
- 使用QScatterDataProxy 向图表设置数据
- 创建并添加自定义输入处理程序
有关基本应用程序的创建,请参阅“条形图”。
设置散点图
- 在
ScatterDataModifier的构造函数中设置图表的一些视觉属性:m_graph->setShadowQuality(QtGraphs3D::ShadowQuality::SoftHigh); m_graph->setCameraPreset(QtGraphs3D::CameraPreset::Front); m_graph->setCameraZoomLevel(80.f); // These are set through active theme m_graph->activeTheme()->setTheme(QGraphsTheme::Theme::MixSeries); m_graph->activeTheme()->setColorScheme(QGraphsTheme::ColorScheme::Dark);这些设置均非必需,但可用于覆盖图表的默认设置。若要查看预设默认值下的外观,可将上面的代码块注释掉。
- 创建一个QScatterDataProxy 及其关联的QScatter3DSeries 。为该数据系列设置自定义标签格式和网格平滑度,并将其添加到图表中:
auto *proxy = new QScatterDataProxy;
auto *series = new QScatter3DSeries(proxy);
series->setItemLabelFormat(u"@xTitle: @xLabel @yTitle: @yLabel @zTitle: @zLabel"_s);
series->setMeshSmooth(m_smooth);
m_graph->addSeries(series);
添加散点图数据
- 在
ScatterDataModifier的构造函数中,将数据添加到图表中:addData(); - 实际的数据添加是在 `
addData()` 方法中完成的。首先,配置坐标轴:m_graph->axisX()->setTitle("X"); m_graph->axisY()->setTitle("Y"); m_graph->axisZ()->setTitle("Z");您也可以在 `
ScatterDataModifier` 的构造函数中执行此操作。在此处进行配置既能简化构造函数,又能使坐标轴配置紧邻数据。 - 创建一个数据数组并填充数据:
QScatterDataArray dataArray; dataArray.reserve(m_itemCount); ... const float limit = qSqrt(m_itemCount) / 2.0f; for (int i = -limit; i < limit; ++i) { for (int j = -limit; j < limit; ++j) { const float x = float(i) + 0.5f; const float y = qCos(qDegreesToRadians(float(i * j) / m_curveDivider)); const float z = float(j) + 0.5f; dataArray.append(QScatterDataItem(x, y, z)); } } - 最后,告知代理开始使用我们提供的数据:
m_graph->seriesList().at(0)->dataProxy()->resetArray(dataArray);
现在,图表已包含数据,可以使用了。有关添加小部件以控制图表的信息,请参阅“使用小部件控制图表”。
替换默认输入处理
若要替换默认的输入处理机制,请为 `Q3DScatterWidgetItem` 设置新的输入处理程序,该类实现了自定义行为:
connect(m_graph,
        &Q3DGraphsWidgetItem::selectedElementChanged,
        this,
        &ScatterDataModifier::handleElementSelected);
connect(m_graph, &Q3DGraphsWidgetItem::dragged, this, &ScatterDataModifier::handleAxisDragging);
m_graph->setDragButton(Qt::LeftButton);
扩展鼠标事件处理
实现一个新的drag 事件处理程序。它为轴拖动计算提供鼠标移动距离(详情请参阅“实现轴拖动”):
connect(m_graph,
        &Q3DGraphsWidgetItem::selectedElementChanged,
        this,
        &ScatterDataModifier::handleElementSelected);
connect(m_graph, &Q3DGraphsWidgetItem::dragged, this, &ScatterDataModifier::handleAxisDragging);
m_graph->setDragButton(Qt::LeftButton);
实现轴拖动
- 开始监听来自图表的选中信号。在构造函数中完成此操作,并将该信号连接到
handleElementSelected方法:connect(m_graph, &Q3DGraphsWidgetItem::selectedElementChanged, this, &ScatterDataModifier::handleElementSelected); connect(m_graph, &Q3DGraphsWidgetItem::dragged, this, &ScatterDataModifier::handleAxisDragging); m_graph->setDragButton(Qt::LeftButton); - 在
handleElementSelected中,检查选中的类型,并根据其类型设置内部状态:switch (type) { case QtGraphs3D::ElementType::AxisXLabel: m_state = StateDraggingX; break; case QtGraphs3D::ElementType::AxisYLabel: m_state = StateDraggingY; break; case QtGraphs3D::ElementType::AxisZLabel: m_state = StateDraggingZ; break; default: m_state = StateNormal; break; } - 实际的拖动逻辑在
handleAxisDragging方法中实现,该方法由drag事件调用:void ScatterDataModifier::handleAxisDragging(QVector2D delta) - 在 `
handleAxisDragging` 中,首先从活动摄像机获取场景方向:// Get scene orientation from active camera float xRotation = m_graph->cameraXRotation(); float yRotation = m_graph->cameraYRotation(); - 根据该方向计算鼠标移动方向的修正因子:
// Calculate directional drag multipliers based on rotation float xMulX = qCos(qDegreesToRadians(xRotation)); float xMulY = qSin(qDegreesToRadians(xRotation)); float zMulX = qSin(qDegreesToRadians(xRotation)); float zMulY = qCos(qDegreesToRadians(xRotation)); - 计算鼠标移动量,并根据摄像机的 y 轴旋转对其进行调整:
// Get the drag amount QPoint move = delta.toPoint(); // Flip the effect of y movement if we're viewing from below float yMove = (yRotation < 0) ? -move.y() : move.y(); - 将移动距离应用到正确的轴上:
// Adjust axes
QValue3DAxis *axis = nullptr;
switch (m_state) {
case StateDraggingX:
    axis = m_graph->axisX();
    distance = (move.x() * xMulX - yMove * xMulY) / m_dragSpeedModifier;
    axis->setRange(axis->min() - distance, axis->max() - distance);
    break;
case StateDraggingZ:
    axis = m_graph->axisZ();
    distance = (move.x() * zMulX + yMove * zMulY) / m_dragSpeedModifier;
    axis->setRange(axis->min() + distance, axis->max() + distance);
    break;
case StateDraggingY:
    axis = m_graph->axisY();
    distance = move.y() / m_dragSpeedModifier; // No need to use adjusted y move here
    axis->setRange(axis->min() + distance, axis->max() + distance);
    break;
default:
    break;
}
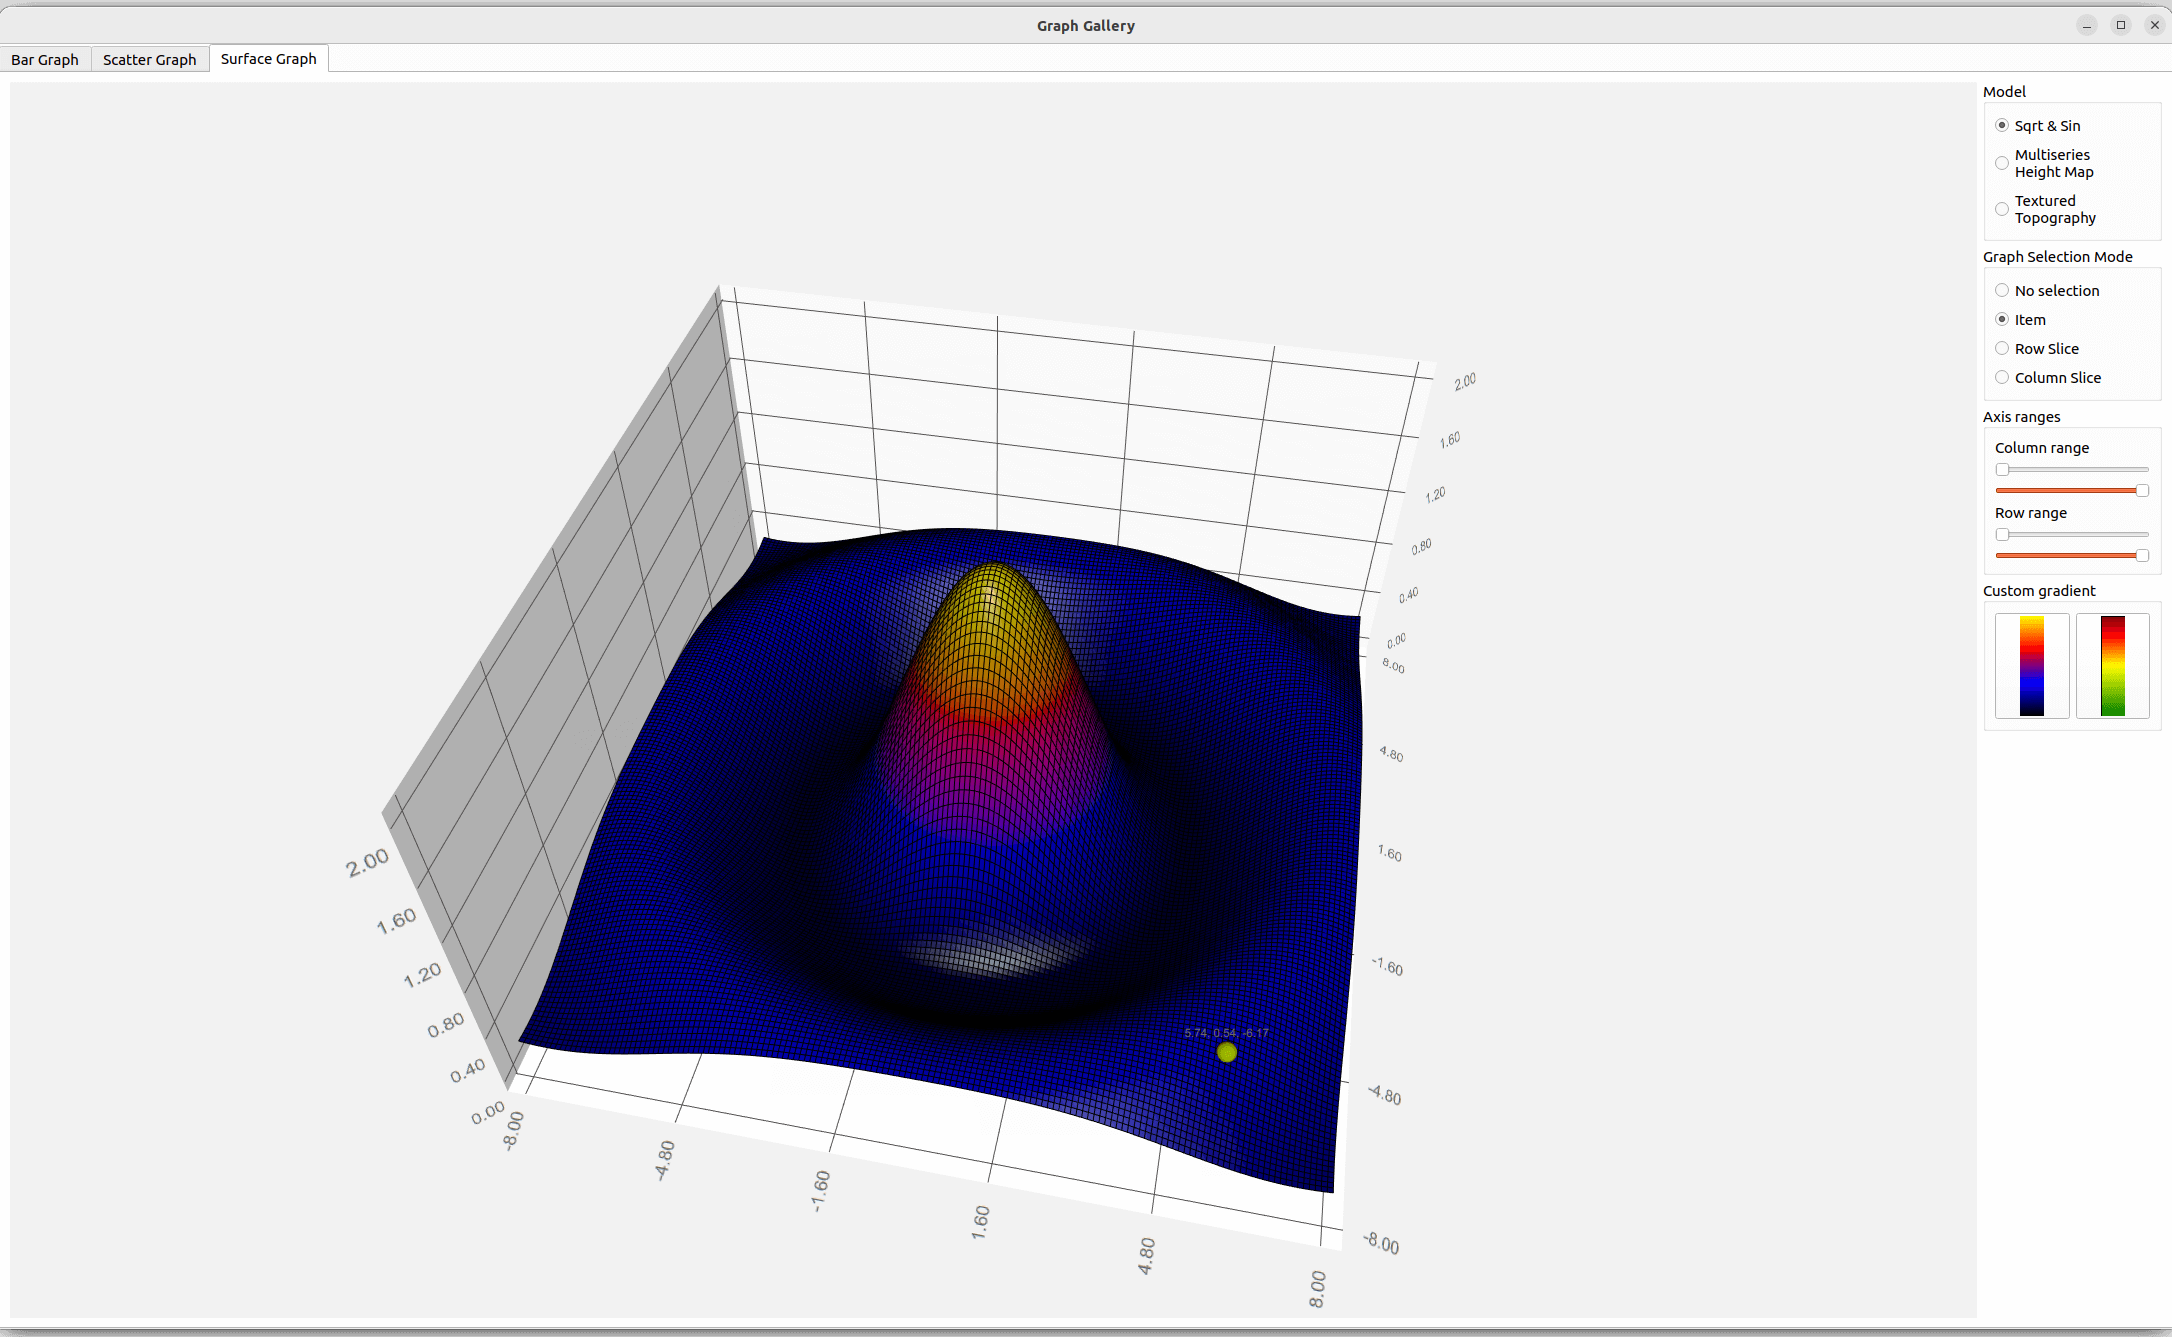
曲面图
在“Surface Graph ”选项卡中,使用Q3DSurfaceWidgetItem 创建一个3D曲面图。本示例演示了如何:
- 设置一个基本的“QSurfaceDataProxy ”并为其配置数据。
- 使用QHeightMapSurfaceDataProxy 显示3D高程图。
- 使用地形数据创建 3D 高程图。
- 使用三种不同的选择模式来研究图表。
- 使用坐标轴范围来显示图表的选定部分。
- 设置自定义表面渐变。
- 使用QCustom3DItem 和QCustom3DLabel 添加自定义项目和标签。
- 使用自定义输入处理程序来启用缩放和平移功能。
- 突出显示曲面上的某个区域。
有关基本应用程序的创建,请参阅“条形图”。
带有生成数据的简单曲面
- 首先,实例化一个新的QSurfaceDataProxy ,并将其附加到一个新的QSurface3DSeries 上:
m_sqrtSinProxy = new QSurfaceDataProxy(); m_sqrtSinSeries = new QSurface3DSeries(m_sqrtSinProxy); - 向代理中填充简单的平方根和正弦波数据。创建一个
QSurfaceDataArray实例,并向其中添加QSurfaceDataRow元素。通过调用resetArray(),将创建的QSurfaceDataArray设置为QSurfaceDataProxy 的数据数组。QSurfaceDataArray dataArray; dataArray.reserve(sampleCountZ); for (int i = 0; i < sampleCountZ; ++i) { QSurfaceDataRow newRow; newRow.reserve(sampleCountX); // Keep values within range bounds, since just adding step can cause minor // drift due to the rounding errors. float z = qMin(sampleMax, (i * stepZ + sampleMin)); for (int j = 0; j < sampleCountX; ++j) { float x = qMin(sampleMax, (j * stepX + sampleMin)); float R = qSqrt(z * z + x * x) + 0.01f; float y = (qSin(R) / R + 0.24f) * 1.61f; newRow.append(QSurfaceDataItem(x, y, z)); } dataArray.append(newRow); } m_sqrtSinProxy->resetArray(dataArray);
多系列高度图数据
通过实例化一个QHeightMapSurfaceDataProxy 并传入包含高度数据的QImage 来创建高度图。使用QHeightMapSurfaceDataProxy::setValueRanges()来定义地图的数值范围。 在本示例中,高度图的范围为北纬 34.0° 至 40.0°、东经 18.0° 至 24.0°(均为虚构坐标)。这些值用于将高度图定位在坐标轴上。
// Create the first surface layer
QImage heightMapImageOne(":/data/layer_1.png");
m_heightMapProxyOne = new QHeightMapSurfaceDataProxy(heightMapImageOne);
m_heightMapSeriesOne = new QSurface3DSeries(m_heightMapProxyOne);
m_heightMapSeriesOne->setItemLabelFormat(u"(@xLabel, @zLabel): @yLabel"_s);
m_heightMapProxyOne->setValueRanges(34.f, 40.f, 18.f, 24.f);
以同样的方式添加其他地表图层,即使用高程图图像为它们创建代理和序列。-
地形图数据
地形数据来自芬兰国家土地测量局。该机构提供了一款名为Elevation Model 2 m 的产品,非常适合本示例。
地形数据来自莱维山(Levi fell)。该数据的精度远超实际需求,因此将其压缩并编码为 PNG 文件。原始 ASCII 数据的高度值通过乘法因子被编码为 RGB 格式,如下面的代码示例所示。 该乘数是通过将24位最大值除以芬兰最高点的海拔高度计算得出的。
QHeightMapSurfaceDataProxy 仅转换单字节值。若要利用芬兰国家土地测量局提供的更高精度数据,请从 PNG 文件中读取数据并将其解码为QSurface3DSeries 格式。
- 定义编码乘数:
// Value used to encode height data as RGB value on PNG file const float packingFactor = 11983.f; - 执行实际解码:
QImage heightMapImage(file);
uchar *bits = heightMapImage.bits();
int imageHeight = heightMapImage.height();
int imageWidth = heightMapImage.width();
int widthBits = imageWidth * 4;
float stepX = width / float(imageWidth);
float stepZ = height / float(imageHeight);

QSurfaceDataArray dataArray;
dataArray.reserve(imageHeight);
for (int i = 0; i < imageHeight; ++i) {
    int p = i * widthBits;
    float z = height - float(i) * stepZ;
    QSurfaceDataRow newRow;
    newRow.reserve(imageWidth);
    for (int j = 0; j < imageWidth; ++j) {
        uchar aa = bits[p + 0];
        uchar rr = bits[p + 1];
        uchar gg = bits[p + 2];
        uint color = uint((gg << 16) + (rr << 8) + aa);
        float y = float(color) / packingFactor;
        newRow.append(QSurfaceDataItem(float(j) * stepX, y, z));
        p += 4;
    }
    dataArray.append(newRow);
}

dataProxy()->resetArray(dataArray);
现在,Surface Graph 可以通过代理读取数据。
选择数据集
为了演示不同的代理,Surface Graph 提供了三个单选按钮,用于在不同数据系列之间切换。
使用“Sqrt & Sin ”时,生成的简单数据系列会被激活。
- 设置装饰性功能,例如启用曲面的网格,并选择平面着色模式。
- 定义坐标轴标签格式和数值范围。设置自动标签旋转,以在低摄像机角度下提高标签的可读性。
- 确保将正确的系列添加到图表中,而其他系列未被添加。
m_sqrtSinSeries->setDrawMode(QSurface3DSeries::DrawSurfaceAndWireframe);
m_sqrtSinSeries->setShading(QSurface3DSeries::Shading::Flat);

m_graph->axisX()->setLabelFormat("%.2f");
m_graph->axisZ()->setLabelFormat("%.2f");
m_graph->axisX()->setRange(sampleMin, sampleMax);
m_graph->axisY()->setRange(0.f, 2.f);
m_graph->axisZ()->setRange(sampleMin, sampleMax);
m_graph->axisX()->setLabelAutoAngle(30.f);
m_graph->axisY()->setLabelAutoAngle(90.f);
m_graph->axisZ()->setLabelAutoAngle(30.f);

m_graph->removeSeries(m_heightMapSeriesOne);
m_graph->removeSeries(m_heightMapSeriesTwo);
m_graph->removeSeries(m_heightMapSeriesThree);
m_graph->removeSeries(m_topography);
m_graph->removeSeries(m_highlight);

m_graph->addSeries(m_sqrtSinSeries);使用Multiseries Height Map 时,高程图序列将被激活,其余序列将被禁用。Y轴范围的自动调整对高程图表面效果良好,因此请确保已启用此设置。
m_graph->axisY()->setAutoAdjustRange(true);使用Textured Topography 时,地形数据系列处于激活状态,其余系列被禁用。为该系列启用自定义输入处理程序,以便对其上的区域进行高亮显示:
m_graph->setDragButton(Qt::LeftButton);
QObject::connect(m_graph,
                 &Q3DGraphsWidgetItem::dragged,
                 this,
                 &SurfaceGraphModifier::handleAxisDragging);

QObject::connect(m_graph,
                 &Q3DGraphsWidgetItem::wheel,
                 this,
                 &SurfaceGraphModifier::onWheel);
m_graph->setZoomEnabled(false);有关此数据集的自定义输入处理程序的信息,请参阅《使用自定义输入处理程序启用缩放和平移》。
选择模式
Q3DSurfaceWidgetItem 支持的三种选择模式可通过单选按钮进行控制。要启用或取消所选模式,请添加以下内联方法:
void toggleModeNone() { m_graph->setSelectionMode(QtGraphs3D::SelectionFlag::None); }
void toggleModeItem() { m_graph->setSelectionMode(QtGraphs3D::SelectionFlag::Item); }
void toggleModeSliceRow()
{
    m_graph->setSelectionMode(QtGraphs3D::SelectionFlag::ItemAndRow
                              | QtGraphs3D::SelectionFlag::Slice
                              | QtGraphs3D::SelectionFlag::MultiSeries);
}
void toggleModeSliceColumn()
{
    m_graph->setSelectionMode(QtGraphs3D::SelectionFlag::ItemAndColumn
                              | QtGraphs3D::SelectionFlag::Slice
                              | QtGraphs3D::SelectionFlag::MultiSeries);
}若要支持同时对图表中所有可见系列进行切片选择,请为行和列选择模式添加QtGraphs3D::SelectionFlag::Slice 和QtGraphs3D::SelectionFlag::MultiSeries 标志。
用于分析图表的坐标轴范围
该示例包含四个滑块控件,用于调整 X 轴和 Z 轴的最小值和最大值。选择代理时,这些滑块会自动调整以匹配当前数据集的坐标轴范围:
// Reset range sliders for Sqrt & Sin
m_rangeMinX = sampleMin;
m_rangeMinZ = sampleMin;
m_stepX = (sampleMax - sampleMin) / float(sampleCountX - 1);
m_stepZ = (sampleMax - sampleMin) / float(sampleCountZ - 1);
m_axisMinSliderX->setMinimum(0);
m_axisMinSliderX->setMaximum(sampleCountX - 2);
m_axisMinSliderX->setValue(0);
m_axisMaxSliderX->setMinimum(1);
m_axisMaxSliderX->setMaximum(sampleCountX - 1);
m_axisMaxSliderX->setValue(sampleCountX - 1);
m_axisMinSliderZ->setMinimum(0);
m_axisMinSliderZ->setMaximum(sampleCountZ - 2);
m_axisMinSliderZ->setValue(0);
m_axisMaxSliderZ->setMinimum(1);
m_axisMaxSliderZ->setMaximum(sampleCountZ - 1);
m_axisMaxSliderZ->setValue(sampleCountZ - 1);
若要支持通过控件将 X 范围设置到图表中,请添加:
void SurfaceGraphModifier::setAxisXRange(float min, float max)
{
    m_graph->axisX()->setRange(min, max);
}
以相同方式添加对 Z 范围的支持。
自定义曲面渐变
使用Sqrt & Sin 数据集时,可通过两个按钮启用自定义表面渐变。使用QLinearGradient 定义渐变,并在其中设置所需颜色。此外,将颜色样式更改为Q3DTheme::ColorStyle::RangeGradient以应用该渐变。
QLinearGradient gr;
gr.setColorAt(0.f, Qt::black);
gr.setColorAt(0.33f, Qt::blue);
gr.setColorAt(0.67f, Qt::red);
gr.setColorAt(1.f, Qt::yellow);

m_sqrtSinSeries->setBaseGradient(gr);
m_sqrtSinSeries->setColorStyle(QGraphsTheme::ColorStyle::RangeGradient);
将自定义网格添加到应用程序
要将自定义网格添加到应用程序中:
- 对于 CMake 构建,请将网格文件添加到
CMakeLists.txt中:set(graphgallery_resource_files ... "data/oilrig.mesh" "data/pipe.mesh" "data/refinery.mesh" ... ) qt6_add_resources(widgetgraphgallery "widgetgraphgallery" PREFIX "/" FILES ${graphgallery_resource_files} ) - 对于 qmake 构建,请将网格文件添加到 qrc 资源文件中:
<RCC>
    <qresource prefix="/">
        ...
        <file>data/refinery.mesh</file>
        <file>data/oilrig.mesh</file>
        <file>data/pipe.mesh</file>
        ...
    </qresource>
</RCC>
向图中添加自定义项
使用Multiseries Height Map 数据集时,自定义项会被插入到图形中,并可通过复选框进行开启或关闭。其他视觉效果也可通过另一组复选框进行控制,包括顶层两个图层的透明度设置,以及底层图层的高亮显示。
- 创建一个小型QImage 。将其填充为单一颜色,作为自定义对象的颜色:
- 将项目的位置指定到一个变量中。随后可利用该位置从图表中移除正确的项目:
QVector3D positionOne = QVector3D(39.f, 77.f, 19.2f); - 创建一个包含所有参数的新QCustom3DItem :
auto *item = new QCustom3DItem(":/data/oilrig.mesh", positionOne, QVector3D(0.0125f, 0.0125f, 0.0125f), QQuaternion::fromAxisAndAngle(0.f, 1.f, 0.f, 45.f), color); - 将该项添加到图表中:
m_graph->addCustomItem(item);
向图形添加自定义标签
添加自定义标签与添加自定义项非常相似。对于标签,无需自定义网格,只需一个QCustom3DLabel 实例即可:
auto *label = new QCustom3DLabel();
label->setText("Oil Rig One");
label->setPosition(positionOneLabel);
label->setScaling(QVector3D(1.f, 1.f, 1.f));
m_graph->addCustomItem(label);
从图中移除自定义项
要从图中移除特定项目,请调用removeCustomItemAt() 方法并传入该项目的位置:
m_graph->removeCustomItemAt(positionOne);注意: 从图中移除 自定义项也会删除该对象。若要保留该项,请改用releaseCustomItem() 方法。
将纹理应用于曲面系列
利用Textured Topography 数据集,创建一张用于地形高度图的地图纹理。
使用QSurface3DSeries::setTextureFile() 将一张图像设置为曲面的纹理。添加一个复选框来控制是否设置纹理,并添加一个处理程序以响应复选框的状态:
void SurfaceGraphModifier::toggleSurfaceTexture(bool enable)
{
    if (enable)
        m_topography->setTextureFile(":/data/maptexture.jpg");
    else
        m_topography->setTextureFile("");
}
本示例中的图像从 JPG 文件中读取。使用该方法设置空文件将清除纹理,此时表面将使用主题中的渐变或颜色。
使用自定义输入处理程序启用缩放和平移
利用Textured Topography 数据集,创建一个自定义输入处理程序,用于在图表上突出显示选区并允许平移图表。
平移的实现与“实现轴拖动”中展示的类似。区别在于,在本示例中,您仅沿 X 和 Z 轴进行跟踪,且不允许将表面拖动到图表之外。要限制拖动范围,请遵循轴的边界限制,若超出图表范围则不执行任何操作:
case StateDraggingX:
    distance = (move.x() * xMulX - move.y() * xMulY) * m_speedModifier;
    m_axisXMinValue -= distance;
    m_axisXMaxValue -= distance;
    if (m_axisXMinValue < m_areaMinValue) {
        float dist = m_axisXMaxValue - m_axisXMinValue;
        m_axisXMinValue = m_areaMinValue;
        m_axisXMaxValue = m_axisXMinValue + dist;
    }
    if (m_axisXMaxValue > m_areaMaxValue) {
        float dist = m_axisXMaxValue - m_axisXMinValue;
        m_axisXMaxValue = m_areaMaxValue;
        m_axisXMinValue = m_axisXMaxValue - dist;
    }
    m_graph->axisX()->setRange(m_axisXMinValue, m_axisXMaxValue);
break;对于缩放操作,捕获wheelEvent 事件,并根据QWheelEvent 上的delta值调整X轴和Y轴的范围。调整Y轴,以确保Y轴与XZ平面之间的纵横比保持不变。这样可以防止图形中高度被夸大:
void SurfaceGraphModifier::onWheel(QWheelEvent *event)
{
    float delta = float(event->angleDelta().y());

    m_axisXMinValue += delta;
    m_axisXMaxValue -= delta;
    m_axisZMinValue += delta;
    m_axisZMaxValue -= delta;
    checkConstraints();

    float y = (m_axisXMaxValue - m_axisXMinValue) * m_aspectRatio;

    m_graph->axisX()->setRange(m_axisXMinValue, m_axisXMaxValue);
    m_graph->axisY()->setRange(100.f, y);
    m_graph->axisZ()->setRange(m_axisZMinValue, m_axisZMaxValue);
}
接下来,为缩放级别设置一些限制,以免其离表面过近或过远。 例如,如果 X 轴的值低于允许的下限(即缩放距离过大),则该值将被设为允许的最小值。如果范围将低于范围下限,则会调整轴的两端,以确保范围保持在限制内:
if (m_axisXMinValue < m_areaMinValue)
    m_axisXMinValue = m_areaMinValue;
if (m_axisXMaxValue > m_areaMaxValue)
    m_axisXMaxValue = m_areaMaxValue;
// Don't allow too much zoom in
if ((m_axisXMaxValue - m_axisXMinValue) < m_axisXMinRange) {
    float adjust = (m_axisXMinRange - (m_axisXMaxValue - m_axisXMinValue)) / 2.f;
    m_axisXMinValue -= adjust;
    m_axisXMaxValue += adjust;
}
突出显示曲面上的某个区域
要实现表面上的高亮显示,需创建该数列的副本,并对 y 值进行偏移。在此示例中,HighlightSeries 类在其handlePositionChange 方法中实现了副本的创建。
首先,将原始系列的指针传递给 `HighlightSeries `,然后开始监听 `QSurface3DSeries::selectedPointChanged ` 信号:
void HighlightSeries::setTopographicSeries(TopographicSeries *series)
{
    m_topographicSeries = series;
    m_srcWidth = m_topographicSeries->dataArray().at(0).size();
    m_srcHeight = m_topographicSeries->dataArray().size();

    QObject::connect(m_topographicSeries,
                     &QSurface3DSeries::selectedPointChanged,
                     this,
                     &HighlightSeries::handlePositionChange);
}
当信号触发时,检查位置是否有效。然后,计算复制区域的范围,并检查其是否在边界范围内。最后,用地形序列数据数组中的范围填充高亮序列的数据数组:
void HighlightSeries::handlePositionChange(const QPoint &position)
{
    m_position = position;

    if (position == invalidSelectionPosition()) {
        setVisible(false);
        return;
    }

    int halfWidth = m_width / 2;
    int halfHeight = m_height / 2;

    int startX = position.x() - halfWidth;
    if (startX < 0)
        startX = 0;
    int endX = position.x() + halfWidth;
    if (endX > (m_srcWidth - 1))
        endX = m_srcWidth - 1;
    int startZ = position.y() - halfHeight;
    if (startZ < 0)
        startZ = 0;
    int endZ = position.y() + halfHeight;
    if (endZ > (m_srcHeight - 1))
        endZ = m_srcHeight - 1;

    const QSurfaceDataArray &srcArray = m_topographicSeries->dataArray();

    QSurfaceDataArray dataArray;
    dataArray.reserve(endZ - startZ);
    for (int i = startZ; i < endZ; ++i) {
        QSurfaceDataRow newRow;
        newRow.reserve(endX - startX);
        QSurfaceDataRow srcRow = srcArray.at(i);
        for (int j = startX; j < endX; ++j) {
            QVector3D pos = srcRow.at(j).position();
            pos.setY(pos.y() + m_heightAdjustment);
            newRow.append(QSurfaceDataItem(pos));
        }
        dataArray.append(newRow);
    }

    dataProxy()->resetArray(dataArray);
    setVisible(true);
}
《渐变至高光》系列
由于HighlightSeries 是QSurface3DSeries ,因此可以使用系列所具备的所有装饰方法。在本示例中,我们将添加渐变效果以突出海拔高度。由于合适的渐变样式取决于Y轴的范围,而我们在缩放时会改变该范围,因此需要随着范围的变化调整渐变色位置。可通过为渐变色位置定义比例值来实现:
const float darkRedPos = 1.f;
const float redPos = 0.8f;
const float yellowPos = 0.6f;
const float greenPos = 0.4f;
const float darkGreenPos = 0.2f;
渐变的修改是在 `handleGradientChange ` 方法中进行的,因此需将其与 Y 轴的变化关联起来:
QObject::connect(m_graph->axisY(),
                 &QValue3DAxis::maxChanged,
                 m_highlight,
                 &HighlightSeries::handleGradientChange);
当 Y 轴最大值发生变化时,计算新的渐变颜色位置:
void HighlightSeries::handleGradientChange(float value)
{
    float ratio = m_minHeight / value;

    QLinearGradient gr;
    gr.setColorAt(0.f, Qt::black);
    gr.setColorAt(darkGreenPos * ratio, Qt::darkGreen);
    gr.setColorAt(greenPos * ratio, Qt::green);
    gr.setColorAt(yellowPos * ratio, Qt::yellow);
    gr.setColorAt(redPos * ratio, Qt::red);
    gr.setColorAt(darkRedPos * ratio, Qt::darkRed);

    setBaseGradient(gr);
    setColorStyle(QGraphsTheme::ColorStyle::RangeGradient);

    handleZoomChange(ratio);
}
示例内容
© 2026 The Qt Company Ltd. Documentation contributions included herein are the copyrights of their respective owners. The documentation provided herein is licensed under the terms of the GNU Free Documentation License version 1.3 as published by the Free Software Foundation. Qt and respective logos are trademarks of The Qt Company Ltd. in Finland and/or other countries worldwide. All other trademarks are property of their respective owners.
