Debugging Qt Quick Applications
A QML debug engine extends the Visual Studio debugger with features of the QML debugging infrastructure, which is a part of the Qt QML module that provides services for debugging, inspecting, and profiling applications via a TCP port. The debug engine implements interfaces from the Active Debugging 7 (AD7) extensibility framework for the Visual Studio debugger.
If a Qt project contains QML resource files, starting a debugging session (for example, by pressing F5) launches the native application and connects to the QML debugging infrastructure of that application. You can see this in the Processes window of the Visual Studio debugger. It lists two processes: a native process and a QML process. The native process corresponds to the actual physical process created for the C++ debugging session. The QML process does not correspond to any physical process that is running on the machine, but represents the connection to the QML debugging runtime within the native process.
The presence of both a native process and a QML process enables setting breakpoints both in C++ or QML code. The Visual Studio debugger forwards breakpoint requests to the appropriate debug engine. A filled circular breakpoint marker in QML code indicates a valid breakpoint. This means that a breakpoint request for that file position was sent to the QML runtime and was confirmed by it.
When a breakpoint is hit, Visual Studio shows the current state of the call stack. Unlike other scenarios of debugging applications that mix several languages, such as .NET and native debugging, the QML debug engine does not provide true mixed mode debugging. It runs concurrently with the native debug engine and is not considered to be related to the native process by the Visual Studio debugger. Therefore, even though you can debug both C++ and QML in the same debugging session, the stack that is shown when a QML breakpoint is hit includes only QML function calls. The C++ context of those calls will not be available.
As in the case of native debugging, while in break mode, it is possible to view and modify the values of local variables in the context of the currently active call stack frame, as well as to create watches for any variable or expression. In the Immediate window, you can evaluate any expression in the context of the current stack frame.
Move the mouse over a QML expression to display an instant watch window. The value of that expression in the current context is displayed and can be modified.
Enabling QML Debugging
To enable QML debugging for a project, select Extensions > Qt VS Tools > Qt Project Settings > QML > Enable QML Debugging > Yes. Select OK to save the project settings.
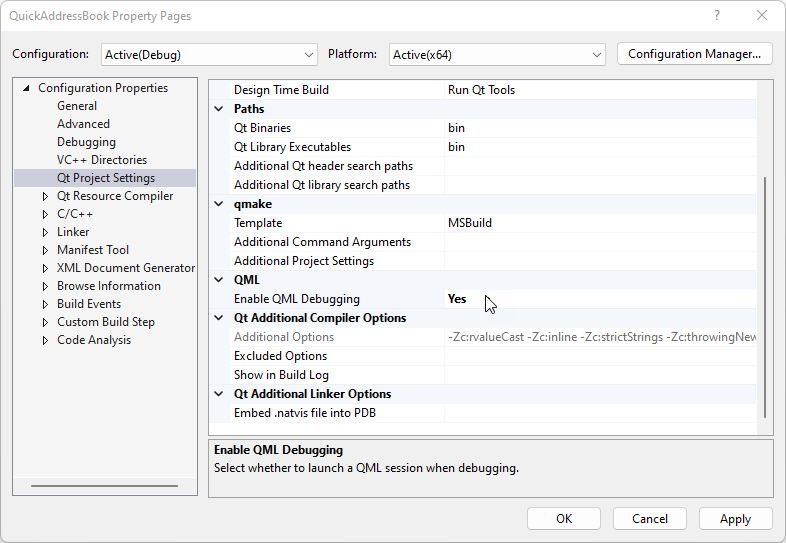
Note: Before launching the debugger, select Build > Rebuild Solution to rebuild the project.
To disable processing of all QML debug events by the QML debug engine, select Extensions > Qt VS Tools > Options > Qt General > QML Debugging, and set Process debug events to False. This effectively excludes the QML debug engine from the debugging environment and disables debugging of QML code for all projects.
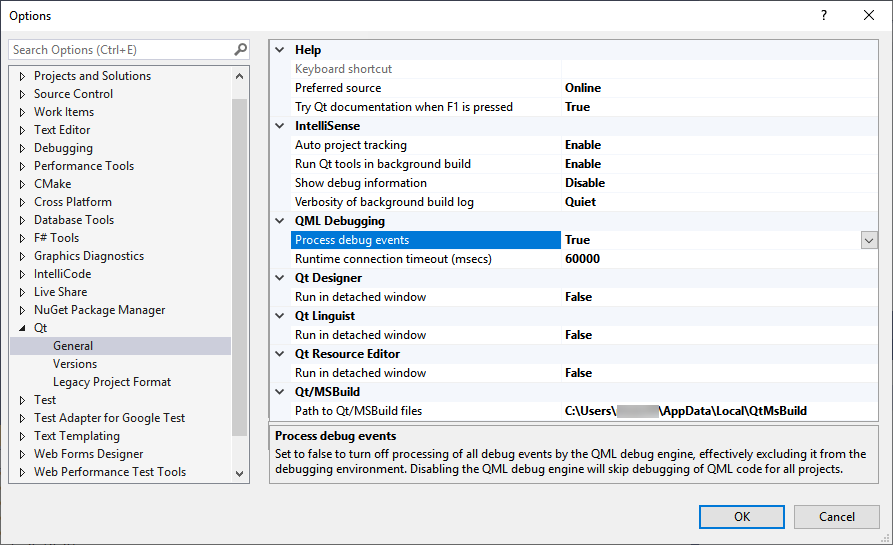
To increase or decrease the timeout for debugging connections in milliseconds, edit the value of Runtime connection timeout. To remove the timeout, set the value to Disabled.
For more information about debugging Qt Quick applications on Linux devices, see Remote QML Debugging.
© 2022 The Qt Company Ltd. Documentation contributions included herein are the copyrights of their respective owners. The documentation provided herein is licensed under the terms of the GNU Free Documentation License version 1.3 as published by the Free Software Foundation. Qt and respective logos are trademarks of The Qt Company Ltd in Finland and/or other countries worldwide. All other trademarks are property of their respective owners.
