Tutorial: Qt Quick Debugging
This tutorial illustrates how to use Qt VS Tools to debug the Qt Quick tutorial application, QuickAddressBook. After you enable QML debugging for the project, you can set breakpoints in QML files and step through the execution of code. While in break mode, you can watch variables and change their values, as well as evaluate arbitrary expressions.
For more information about all the options you have, see Debugging Qt Quick Applications.
Before You Start
Before you start, you have to:
Enable QML Debugging
To enable QML debugging for the project:
- Select Extensions > Qt VS Tools > Qt Project Settings > QML.
- In Enable QML Debugging, select Yes.
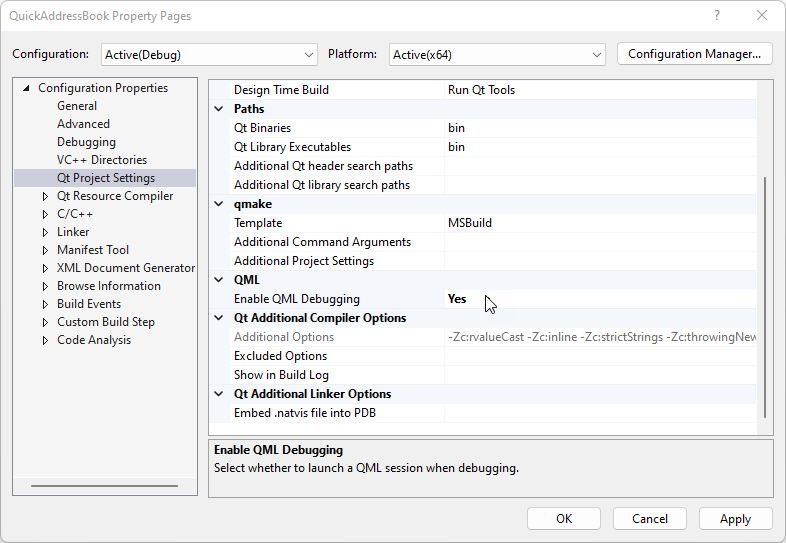
- Select OK to save the project settings.
- Select Build > Rebuild Solution to rebuild the project.
Set a Breakpoint
Select File > Open > File or Solution to open the QuickAddressBook solution.
To look at the code that adds a new contact, add a breakpoint in NewAddressPopup.qml by clicking the line that implements the onClicked signal handler and selecting Debug > Toggle Breakpoint (or pressing F9).
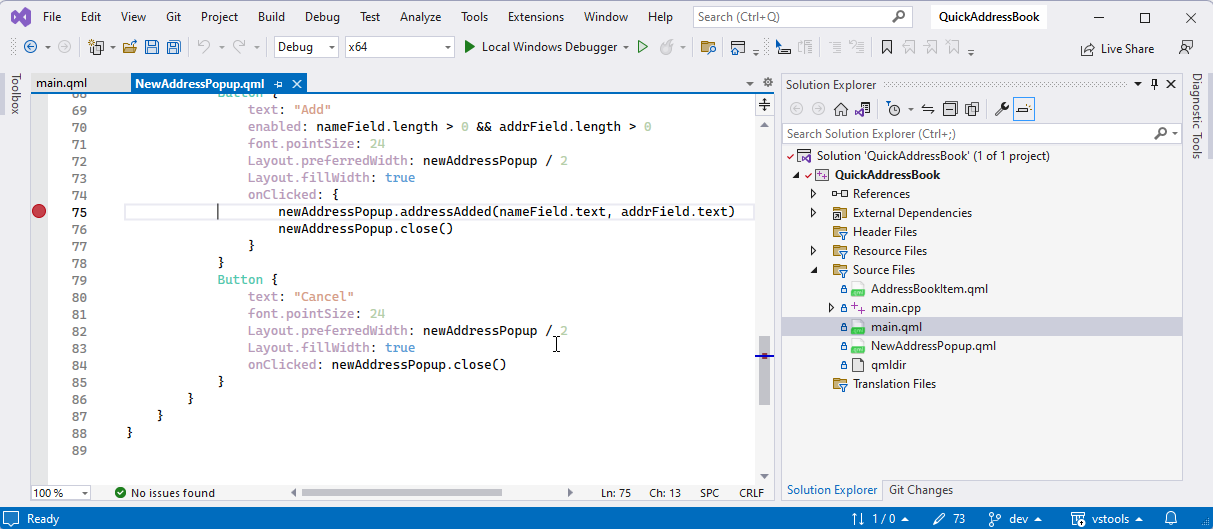
The red circle indicates that a breakpoint is now set on that line.
Start Debugging
Select Debug > Start Debugging or press F5.
Once the application starts, select Add to create a new address book entry. Enter a name and email address, and select Add again to add the entry to the address book.
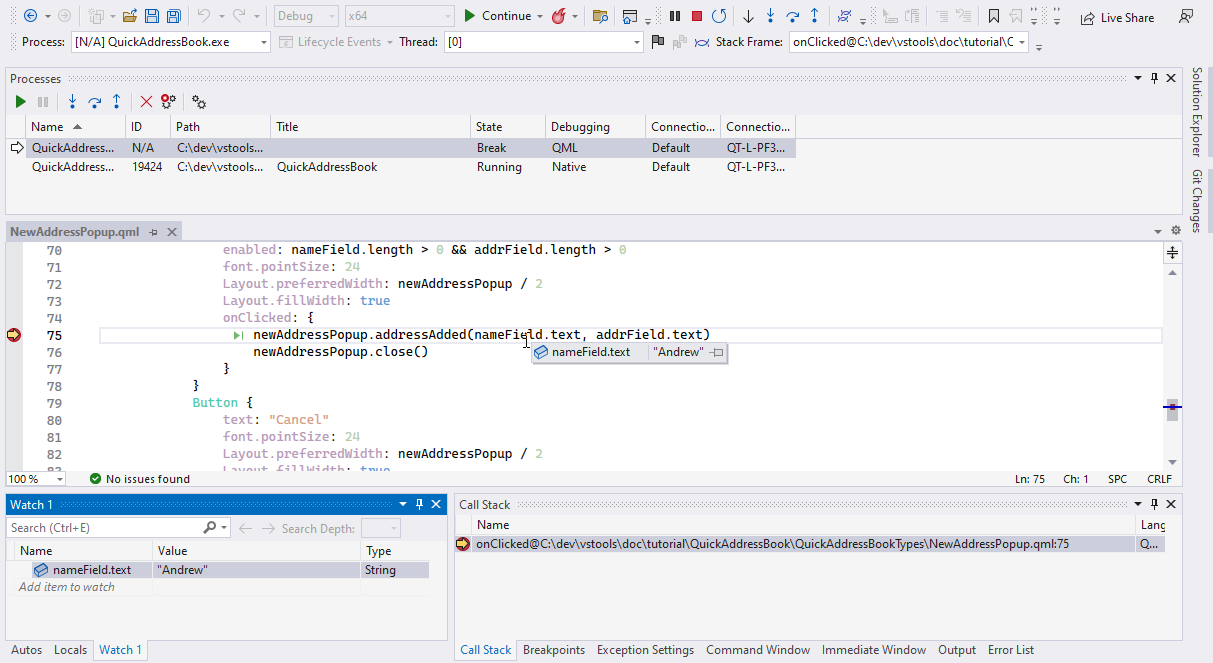
When the debugger hits the breakpoint, it interrupts the application. Qt VS Tools displays the nested function calls leading to the current position as a call stack trace. You can view and modify the values of local variables.
Step Through Code
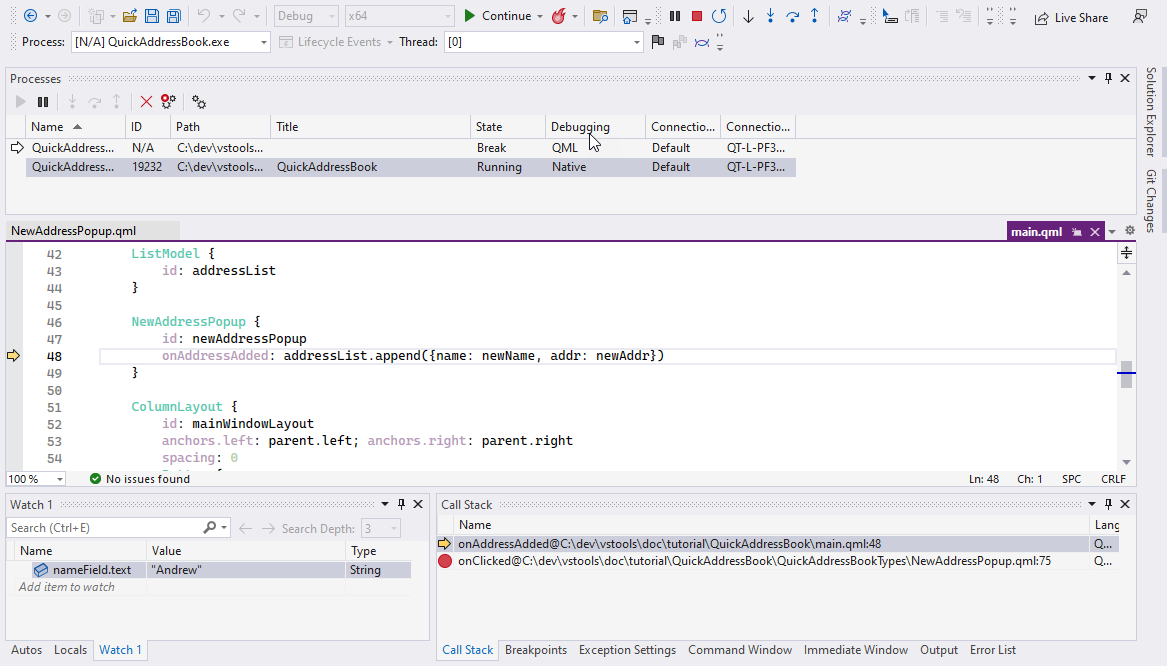
Select Debug > Step Into or press F11 to step into the code in the stack. The NewAddressPopup.qml file opens in the code editor at the function that creates a new address book entry.
Watch Variable Values
The Autos and Locals windows show a subset of local variables that Visual Studio considers possibly interesting based on the location of the breakpoint. To watch a particular variable or expression, set a watch in the Watch 1 view.
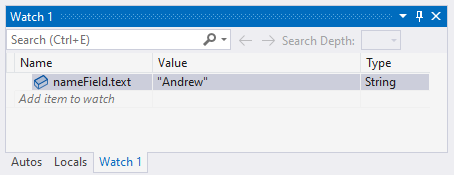
Step through the code to see how the information changes in the view.
Evaluate Expressions
To execute JavaSript commands in the context of the current stack frame, open the Immediate Commands window and type the expression to evaluate.
Remove the Breakpoint
To remove the breakpoint, select Debug > Toggle Breakpoint (or press F9).
© 2022 The Qt Company Ltd. Documentation contributions included herein are the copyrights of their respective owners. The documentation provided herein is licensed under the terms of the GNU Free Documentation License version 1.3 as published by the Free Software Foundation. Qt and respective logos are trademarks of The Qt Company Ltd in Finland and/or other countries worldwide. All other trademarks are property of their respective owners.

