C
Monitor: Verifying the Rendering Output
Monitor demonstrates how you can verify the rendering output of the Indicators example. Monitor is not a standalone example. Instead, use it always together with Indicators. On QNX, INTEGRITY, and Embedded Linux, you also need Message Proxy that forwards events to the Qt Safe Renderer process on your target device.
For each safety-critical QML type in Indicators, Monitor reads the expected CRC (Cyclic Redundancy Check) value from the layout file and compares it with the actual CRC value. Monitor prints the failed verification result either to the Qt Creator's Application Output window or standard output stream.
You can run the Monitor example both in your host environment and the target device. Also, the output verification is supported in the OpenWFD platform adaptation.
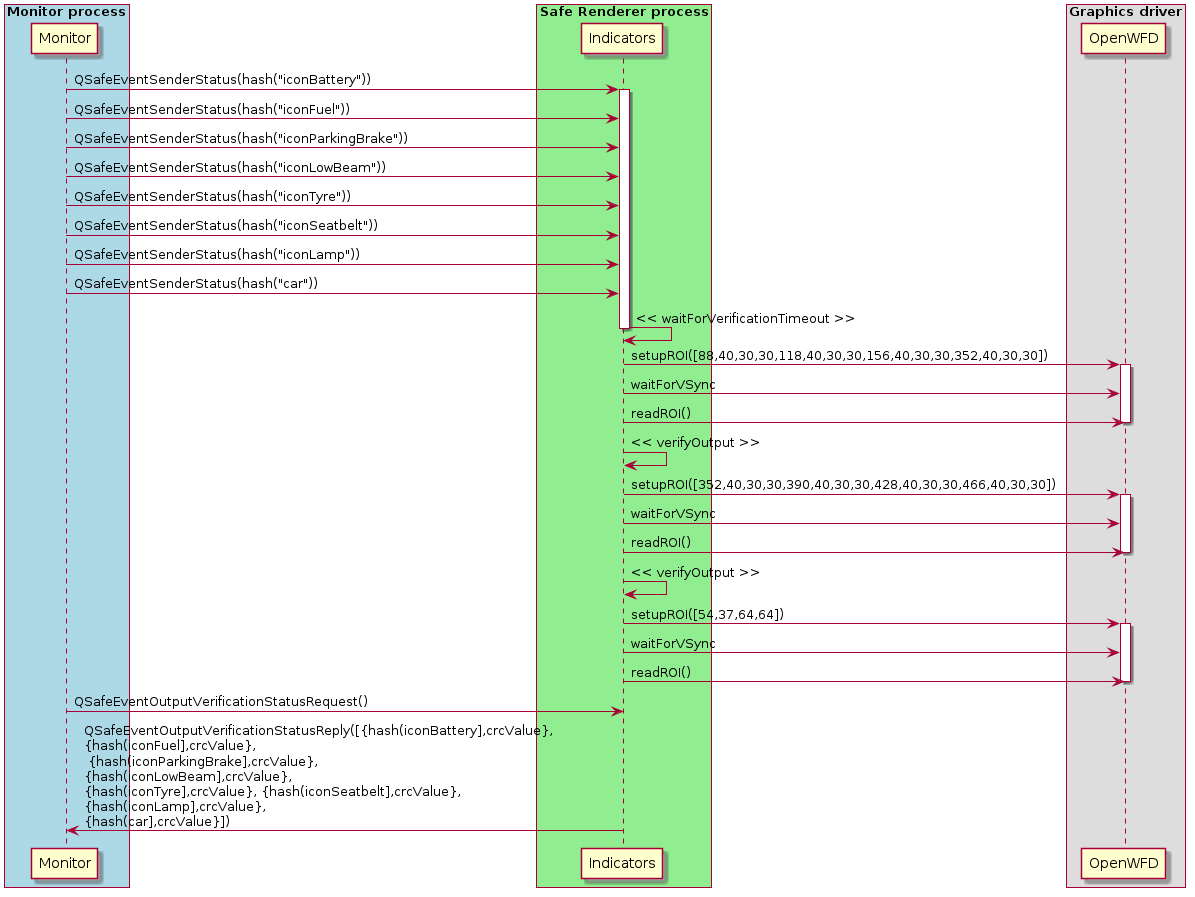
The following sequence diagram shows the communication between Monitor, Indicators, and OpenWFD. When you start Monitor, it connects to the Indicators process using the TCP/IP socket. The TCP/IP implementation uses the POSIX API. Most of the operating system provides the POSIX but in Windows, you must use for example Cygwin or Windows Subsystem for Linux (WSL).
You find Monitor, Indicators, and Message Proxy under the Qt Safe Renderer installation folder as follows:
- Monitor - <Qt installation directory>/Examples/QtSafeRenderer-<version>/saferenderer/monitor
- Indicators - <Qt installation directory>/Examples/QtSafeRenderer-<version>/saferenderer/indicators
- Message Proxy - <Qt installation directory>/Examples/QtSafeRenderer-<version>/saferenderer/messageproxy
The following topics describe how you enable output verification on Indicators, and build and run the Monitor, Indicators, and Message Proxy with Qt Creator.
You can also build and run the examples on the command line.
Enabling Output Verification in Indicators
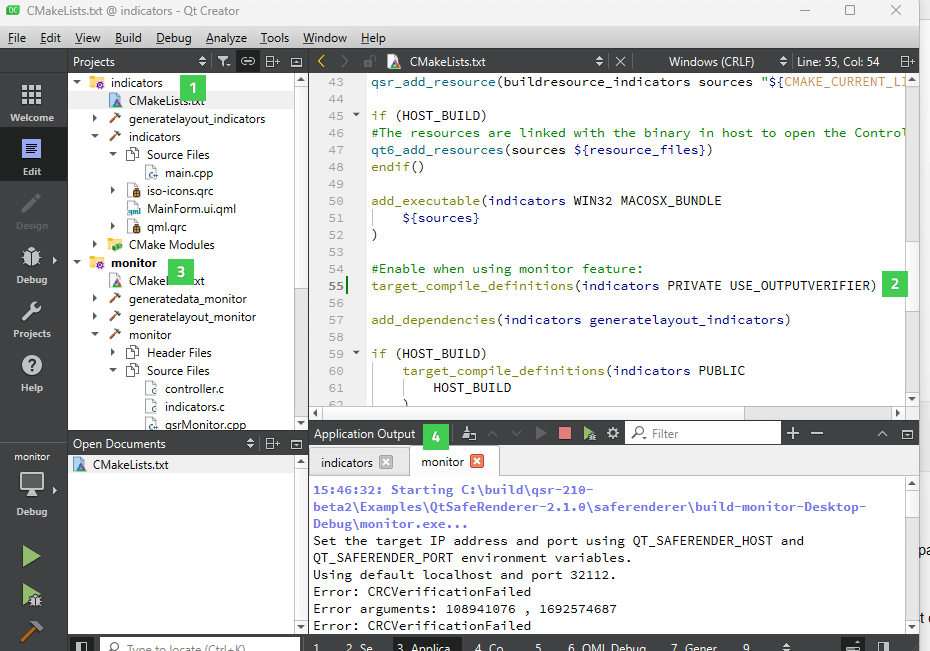
Open Indicators in Qt Creator (1) and enable the output verification feature by uncommenting the following line on CMakeLists.txt (2):
#Enable when using monitor feature:
target_compile_definitions(indicators PRIVATE USE_OUTPUTVERIFIER)
In qmake project, add the following definition to the Indicators.pro file to enable the output verification:
DEFINES += USE_OUTPUTVERIFIER
In general, Monitor can verify the rendering output of any Qt Safe Renderer application where the output verification feature is enabled. For more information, see Using of OutputVerifier Class.
Running Monitor and Indicators on Host Platform
Open Indicators (1) and Monitor (3) in Qt Creator's Edit mode and select Build > Run for both examples. See Building for Host Platform for more detailed building instructions.
As you have enabled the output verification in Indicators, Monitor automatically changes the visibility of telltales and position of gears in Indicators. The telltales and gears are implemented with safety-critical QML types and when their visibility changes, Monitor reads the expected CRC (Cyclic Redundancy Check) value from the layout file and compares it with the actual CRC value.
You can view the verification statuses in the Application Output pane in Qt Creator (4). Monitor prints the verification result only when the CRC verification fails.
Running Monitor and Indicators on Target Device
Open Indicators (1), Monitor (3), and Message Proxy in Qt Creator's Edit mode. Select Build > Run for all of them.
By default, when run your project, Qt Creator also deploys it to the device defined in the kit, and runs it there. You need to deploy Monitor, Indicators, and Message Proxy to your target device.
See the target-specific building instructions for more detailed information:
- Building for QNX
- Building for INTEGRITY
- How to Create Boot to Qt Image (Embedded Linux)
As you have enabled the output verification in Indicators, Monitor automatically changes the visibility of telltales and position of gears in Indicators. The telltales and gears are implemented with safety-critical QML types and when their visibility changes, Monitor reads the expected CRC (Cyclic Redundancy Check) value from the layout file and compares it with the actual CRC value.
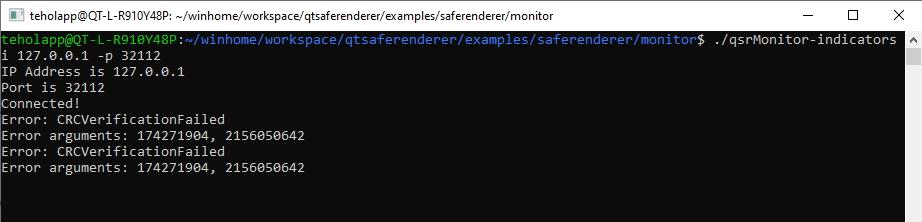
You can view the verification statuses via the standard output stream. Monitor prints the verification result only when the CRC verification fails.
Building from Command Line
You can also build the Monitor and Indicators examples from the command line using the make tool. Build Monitor with the Indicators controller as follows:
make -f Makefile_gcc qsrMonitor-indicators
You can start Monitor from the command line by running the qsrMonitor-indicators binary. You can use the following command line options:
| Option | Description |
|---|---|
| -i | Qt Safe Renderer process |
| -p | The port |
In the desktop application, the default port is 32112. In QNX, INTEGRITY, and Embedded Linux, you also need to run Message Proxy. Message Proxy listens to the port 32123.
Modifying Monitor Example
You can variate the controller functionality. The example controller changes UI states in a predefined order. In real world use case, you must change Qt Safe Renderer states based on the system status which is triggered for example from canbus.
There are two examples of control structures. For more information, see the files demostates.c and indicators.c.
The default error handling prints the error to the std output. The default error handling logic can be changed by implementing a callback function. See the example implementation in the monitorLoop function.
To change the connection method (for example, from TCP/IP to the SPI (Serial Peripheral Interface) or CAN (Controller Area Network) bus), you need to implement connection_stub.c and create a proxy which receives the data from the interface and sends the events to the Qt Safe Renderer process using the platform-specific message queue.
Example Files
Files:
Available under certain Qt licenses.
Find out more.
