Instrumentation of a simple project
This section describes how to instrument a small project with unit tests. The project is a simple expression parser, and it does not have many requirements besides a C++ compiler.
The project replicates in miniature an existing project that has been extended with unit tests and for which we will now use Coco to find out how good the test coverage is. Instrumentation should therefore be non-intrusive and should not change the project very much.
Note: The procedures to set up a project for instrumentation under UNIX® and macOS differ from that for Microsoft® Windows. The setup section has therefore two versions, which appear in the following sections.
UNIX and macOS setup
This example requires the GNU C++ compiler g++ and GNU make. Later, the diff tool must also be present.
The sources for the parser example can be found in Coco's installation directory:
- Under UNIX, this is the directory
/opt/SquishCoco/or, if you have installed Coco locally, the subdirectorySquishCoco/of your home directory. - Under macOS, the installation directory is
/Applications/SquishCoco/.
Note: If you have chosen a custom directory to install Coco, the example will not work without modifications.
We will refer to the installation directory as the SquishCoco/ directory, wherever it is located. The Coco examples, together with their supporting programs, are in SquishCoco/samples/, and the parser is in SquishCoco/samples/parser/. This directory contains different versions of the program, in the directories parser_v1/ to parser_v5/. They represent the parser in different stages of its development.
The example uses CppUnit as its unit test framework. There is a version of CppUnit in the SquishCoco/samples/ directory, and the parser example is prepared to use it.
Before doing anything else, copy the content of the whole samples/ directory to your workspace and make parser_v1/ your working directory. If Coco is installed in /opt/SquishCoco/, this is done in the following way:
$ cp -a /opt/SquishCoco/samples .Make the parser_v1 directory your work directory:
$ cd samples/parser/parser_v1Make also sure that the Coco tools are in your search path. If they are not so already, you can now do it by writing
$ . cocosetup.shDo not forget the dot at the beginning. Now programs like coveragebrowser can be called from the command line.
Structure of the parser directories
We will use samples/parser/parser_v1/ as our working directory. It contains C++ source files and header files, together with an unit test file, unittests.cpp. The makefile has been prepared for unit tests, but not for instrumentation. The instrumentation is done with the help of the bash script instrumented.
Compiling and testing
Run make to compile the program. It is a simple expression parser and calculator.
$ ./parser
Enter an expression an press Enter to calculate the result.
Enter an empty expression to quit.

> 2 + 2
        Ans = 4
> Pi
        Ans = 3.14159
> sin(Pi)
        Ans = 1.22465e-16
> sinn(90)
        Error: Unknown function sinn (col 9)
> sin(90)
        Ans = 0.893997
> cos(pi)
        Ans = -1
>
$
We have added some unit tests for the main class, Parser. Look into the file unittests.cpp to see the tests that have been included. Execute it with make tests. You will see that 14 tests have been executed, and also that one of them has failed. This is for greater realism and also allows us to see later how Coco handles test failures.
Instrumentation
We have kept the instrumentation separate from the main project. The core of the instrumentation is a short shell script, instrumented. It is a simple wrapper, and calling instrumented <command> executes <command> with a few environment variables set. We will do this now. Enter
$ make clean
$ ./instrumented make tests
The first command removes all object files, since we need everything to be recompiled. The second command then compiles the program with instrumentation and runs the tests. That's all!
We now have a look at what the script has done and how it has done it. List the contents of your parser directory:
$ ls
constants.h    functions.o.csmes  parser.cpp       unittests.o
error.cpp      instrumented       parser.h         unittests.o.csmes
error.h        LICENSE            parser.o         variablelist.cpp
error.o        main.cpp           parser.o.csmes   variablelist.h
error.o.csmes  main.o             unittests        variablelist.o
functions.cpp  main.o.csmes       unittests.cpp    variablelist.o.csmes
functions.h    Makefile           unittests.csexe
functions.o    NOTICE             unittests.csmes
You see two kinds of files that do not appear as result of normal compilation. The .csmes files contain the information that is needed for coverage measurement, and the .csexe files contain the results of code execution. The files that end in .o.csmes are temporary files and are only used during compilation.
This time, the only program that was actually executed was unittests, and therefore the only .csexe file is unittests.csexe. To see the coverage results, you can therefore start the CoverageBrowser with the command
$ coveragebrowser -m unittests.csmes -e unittests.csexeThe CoverageBrowser starts with the Load Execution Report dialog open.
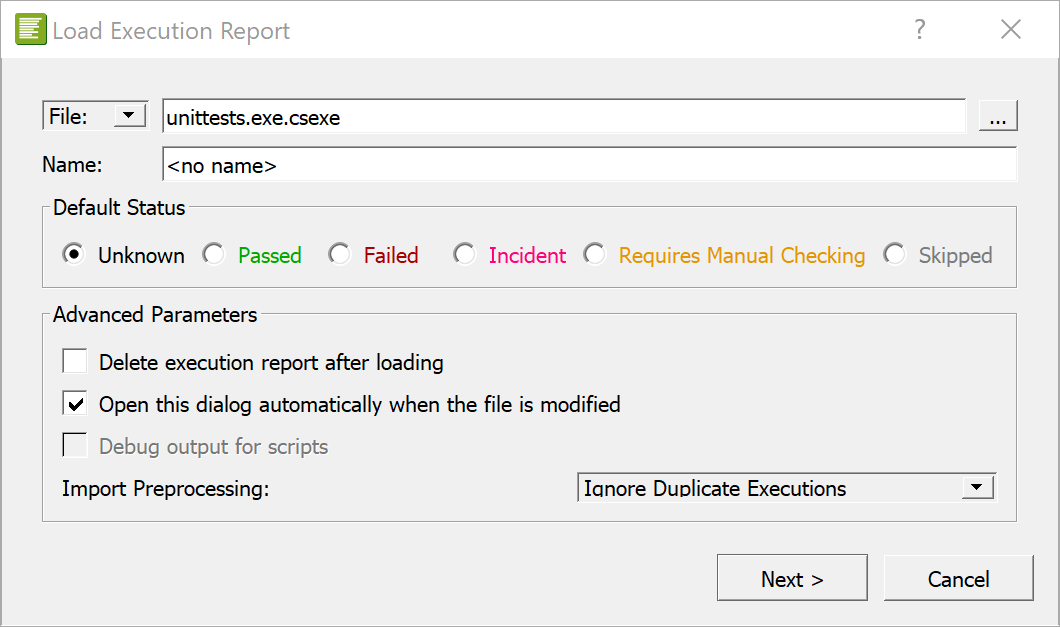
Click Next and then Import to load the data.
This button is called Import & Delete if the Delete execution report after loading checkbox is enabled. This deletes the .csexe file after it is loaded. Select File > Save to save the execution report in the unittests.csexe file.
For the use of CoverageBrowser, see CoverageBrowser reference. We will now describe how the instrumentation is done.
How the project is instrumented
The file instrumented is a short bash script:
#!/bin/bash

. getcoco.sh                    # Get Coco variables

export PATH=$COCO_WRAPPER_DIR:$PATH
export COVERAGESCANNER_ARGS='--cs-on'
export COVERAGESCANNER_ARGS+=' --cs-mcdc'
export COVERAGESCANNER_ARGS+=' --cs-mcc'
# export COVERAGESCANNER_ARGS+=' --cs-function-profiler=all' # Does not work on all platforms

"$@"
At its beginning, the shell script getcoco.sh sets the shell variables SQUISHCOCO, if necessary, to the install location of Squish Coco. Based on that, it sets COCO_WRAPPER_DIR and COCO_BIN_DIR.
(For the parameter --cs-function-profiler and why it is disabled in the script see the section about the function profiler.)
Next, there are some export statements, and the final cryptic statement executes the command line parameters of instrumented. So if you call ./instrumented make tests, the command make tests is executed by the script, but in a different environment than normally.
In the first, the search PATH is manipulated so that the programs in $SQUISHCOCO/wrapper/bin/ are searched first. This directory contains a lot of files with the same names as the compilers that are supported by Coco:
$ ls /opt/SquishCoco/wrapper/bin
ar                            g++-4.9         x86_64-linux-gnu-ar
c89-gcc                       gcc             x86_64-linux-gnu-g++
c99-gcc                       gcc-4.6         x86_64-linux-gnu-g++-4.6
...
Note: There is also ar, which is not a compiler but takes part in the compilation process. This is the output under UNIX; under Mac OS X, the directory /Applications/SquishCoco/wrapper/ contains a much smaller list of files.
These programs are the compiler wrappers. With the new PATH, they are executed instead of the real compilers. The compiler wrappers are actually symbolic links to a single program, coveragescanner (see CoverageScanner reference). When executed to compile a source file, they create an instrumented version of the source and then run the original compiler to compile it.
In the other four export statements, additional flags for the compiler wrappers (see CoverageScanner command line arguments) are set. The most important option is the first one, --cs-on. If it is not present, the compiler wrappers are inactive and just call the compilers they represent. The following options enable MC/DC, Multiple Condition Coverage, and the Function Profiler. They are disabled by default because they are sometimes expensive to execute. Here they are enabled, so that you can see all coverage modes later in the CoverageBrowser.
The resulting script should work without changes for many simple projects. If more customization is needed, it can often be achieved by adding more options to COVERAGESCANNER_ARGS.
Additional changes
It is also convenient to add make targets to handle the files generated by CoverageScanner. In the parser directory, the Makefile has been changed in the following way:
clean: testclean
        ...
        -$(DEL_FILE) *.o.csmes       # (added)

distclean: clean
        ...
        -$(DEL_FILE) *.csmes *.csexe # (added)
Since the .o.csmes files are needed only for compilation, they can be deleted whenever the .o files are deleted (which is that what make clean does). The .csmes and .csexe files are more precious and should only be deleted when all generated files are removed. Therefore we have added their deletion statements to the distclean target.
Note: For Coco setup with other build automation systems and IDEs, see the following chapters at Setup.
Microsoft Windows setup
This example requires Microsoft Visual C++.
The sources for the parser can be found in the directory <Windows Coco>\parser. This directory contains three versions of the program, in the subdirectories parser_v1 to parser_v3. They represent the parser in different stages of its development.
The example uses CppUnit as its unit test framework. There is a version of CppUnit in the <Windows Coco>\squishcoco directory, and the parser example is prepared to use it.
Since these directories are write-protected, you need to create your own working copies. Copy therefore the two directories <Windows Coco>\squishcoco\parser and <Windows Coco>\squishcoco\cppunit-1.12.1 to a directory of your choice. Then remove the write protection of the directories and all the files contained in them.
Structure of the parser directories
We will use parser\parser_v1 as our working directory. It contains C++ source files and header files, together with a unit test file, unittests.cpp. The Makefile has been prepared for unit tests, but not for instrumentation. The instrumentation is done with the help of the batch file instrumented.bat. There are also some files that are needed in the UNIX version. We will ignore them here.
Compiling and testing
We will do the compilation of the example on the command line. To get a command window, execute the batch file CocoCmd.bat that is located in the parser_v1 directory. In this window, the Microsoft Visual Studio command line tools (like nmake) are accessible, and also the main Coco programs (like CoverageBrowser).
Run nmake to compile the program. It is a simple expression parser and calculator.
$ C:\code\parser\parser_v1>parser.exe
Enter an expression an press Enter to calculate the result.
Enter an empty expression to quit.

> 2 + 2
        Ans = 4
> Pi
        Ans = 3.14159
> sin(Pi)
        Ans = 1.22465e-16
> sinn(90)
        Error: Unknown function sinn (col 9)
> sin(90)
        Ans = 0.893997
> cos(pi)
        Ans = -1
>
C:\code\parser\parser_v1>
We have added some unit tests for the main class, Parser. Look into the file unittests.cpp to see the tests that have been included. Execute it with nmake tests. You will see that 14 tests have been executed, and also that one of them has failed. This is for greater realism and also allows us to see later how Coco handles test failures.
Instrumentation
We have kept the instrumentation separate from the main project. The core of the instrumentation is a short shell script, instrumented.bat. It is a simple wrapper, and calling instrumented.bat<command> executes <command> with a few environment variables set. We will do this now. Enter
C:\code\parser\parser_v1>nmake clean
C:\code\parser\parser_v1>instrumented.bat nmake tests
The first command removes all object files, since we need everything to be recompiled. The second command then compiles the program with instrumentation and runs the tests. That's all!
To see what the script has done and how it has done it, list the contents of your parser directory:
C:\code\parser\parser_v1>dir /D

 Directory of C:\code\parser\parser_v1

[.]                      LICENSE                  unittests.exe
[..]                     main.cpp                 unittests.exe.csexe
constants.h              main.obj                 unittests.exe.csmes
error.cpp                main.obj.csmes           unittests.exp
error.h                  Makefile                 unittests.lib
error.obj                nmake.mak                unittests.obj
error.obj.csmes          NOTICE                   unittests.obj.csmes
functions.cpp            parser.cpp               variablelist.cpp
functions.h              parser.h                 variablelist.h
functions.obj            parser.obj               variablelist.obj
functions.obj.csmes      parser.obj.csmes         variablelist.obj.csmes
instrumented             README.squishcoco
instrumented.bat         unittests.cpp
              35 File(s)      1,079,919 bytes
               2 Dir(s)  35,159,457,792 bytes free
You see two kinds of files that do not appear as result of normal compilation. The .csmes files contain the information that is needed for coverage measurement, and the .csexe files contain the results of code execution. The files that end in .obj.csmes are temporary files and are only used during compilation.
When we execute the program unittests, the corresponding .csexe file unittests.exe.csexe is created or updated. To see the coverage results, you can start the CoverageBrowser with the command
C:\code\parser\parser_v1>coveragebrowser -m unittests.exe.csmes -e unittests.exe.csexeThe CoverageBrowser starts with the Load Execution Report dialog open.
Click Next and then Import to load the data.
This button is called Import & Delete if the Delete execution report after loading checkbox is enabled. This deletes the .csexe file after it is loaded. Select File > Save to save the execution report in the unittests.csexe file.
For the use of CoverageBrowser, see CoverageBrowser Reference. We will now describe how the instrumentation is done.
How the project is instrumented
The file instrumented.bat is a short batch file:
@echo off
setlocal

set PATH=%SQUISHCOCO%\visualstudio;%PATH%
set COVERAGESCANNER_ARGS=--cs-on --cs-mcdc --cs-mcc --cs-function-profiler=all

call %*

endlocal
The variable SQUISHCOCO contains the name of the directory where Coco is installed. It is set by Coco during installation.
At the beginning, the setlocal command ensures that the following commands change the environment variables only temporarily. Then there are two set statements, and the final call statement executes the command line parameters of instrumented. So if you call instrumented nmake tests, the command nmake tests is executed by the batch file, but in a different environment. At the end, endlocal undoes the changes in the environment variables.
The important part of the script is the two set statements. In the first one, the search path is manipulated so that the programs in <Windows Coco>\squishcoco\visualstudio are searched first. This directory contains files with the same names as the compilers and the linker.
Note: This is the version for the 32 bit compiler. There is also a directory <Windows Coco>\visualstudio_x64 for 64 bit compilation.
C:\code\parser\parser_v1>dir /d "\Program Files\squishcoco\visualstudio"

 Directory of C:\Program Files\squishcoco\visualstudio

[.]            cl.exe         link.cspro     msvcr100.dll
[..]           lib.cspro      link.exe
cl.cspro       lib.exe        msvcp100.dll
               8 File(s)      5,662,299 bytes
               2 Dir(s)  35,053,502,464 bytes free
The .exe files in this directory are the compiler wrappers. With the new PATH, they are executed instead of the real compiler. Each of the compiler wrappers is actually a copy of a single program, coveragescanner.exe (see CoverageScanner reference). When executed to compile a source file, it creates an instrumented version of the source and then runs the original compiler to compile it.
In the second set statement, additional flags for the compiler wrappers (see CoverageScanner command line arguments) are set. The most important option is the first one, --cs-on. If it is not present, the compiler wrappers are inactive and just call the compilers they represent. The following options enable MC/DC, Multiple Condition Coverage, and the Function Profiler. They are disabled by default because they are sometimes expensive to execute. Here they are enabled so that you can see all coverage modes later in the CoverageBrowser.
The resulting script should work without changes for many simple projects. If more customization is needed, it can often be achieved by adding more options to COVERAGESCANNER_ARGS.
Additional changes
It is also convenient to add make targets to handle the files generated by CoverageScanner. In the parser_v1 directory, the Makefile has been changed in the following way:
clean: testclean
        ...
        -$(DEL_FILE) *.obj.csmes     # (added)

distclean: clean
        ...
        -$(DEL_FILE) *.csmes *.csexe # (added)
Since the .obj.csmes files are needed only for compilation, they can be deleted whenever the .obj files are deleted by make clean. The .csmes and .csexe files are more precious and should only be deleted when all generated files are removed. Therefore we have added their deletion statements to the distclean target.
Note: For Coco setup with other build automation systems and IDEs, see the following chapters at Setup.
Beyond the minimal instrumentation
In the following sections we will show additional abilities of Coco. They will require small changes in the code of the project.
Excluding code from instrumentation
The coverage information generated so far has a problem: It covers too many files. The problematic files are those that belong to the testing framework and not to the tested program. Including them would create artificially low coverage rates.
With Coco, one can exclude files from coverage by additional command line options. In parser_v2, this has been done. Look into parser_v2/instrumented (or parser_v2\instrumented.bat under Microsoft Windows). In it, three additional command line options have been set:
- The option
--cs-exclude-path=../../cppunit-1.12.1excludes the source files of a directory and all its subdirectories. Here we use it to exclude all the files of the CppUnit framework.You can use slashes or backslashes with this option—Coco normalizes them internally.
- The options
–cs-exclude-file-abs-wildcard=*/unittests.cppand–cs-exclude-file-abs-wildcard=*/CppUnitListener.cppexclude specific files. We use them to exclude the filesunittests.cppandCppUnitListener.cpp. (The second file is described below.)
Making the test names visible
For the next modification, we want to change the project such that we know not only whether a line of code is covered by tests, but also by which tests it is covered. For this we will add calls of the CoverageScanner C and C++ Library) to the code, to tell Coco the names of the tests and where they begin and end.
An updated version of the project can be found in the directory parser_v2. The greatest difference to the version in parser_v1 is that the file CppUnitListener.cpp has been added. It is copied almost verbatim from CppUnit. The file contains a class CppUnitListener and a new main() function. The main() function in unittests.cpp has been removed, but the file is otherwise unchanged.
CppUnitListener.cpp provides a unit test listener which allows hooking into the framework before and after the execution of each test. One can thus record additional test information, like the name and the result of a test, in the code coverage data without modifying the test code itself. For a listing of CppUnitListener.cpp and an explanation how it works, see CppUnit.
Now you can execute this program the same way as its previous version. View the results in the CoverageBrowser. In the Executions subwindow you can now see the code coverage for each single test. You can especially see that it was the test testInvalidNumber that had failed.
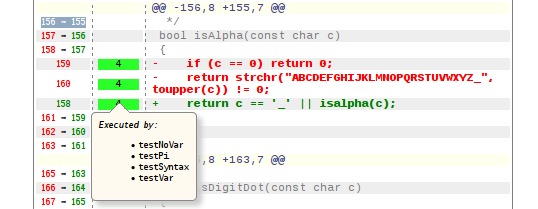
Hover with your mouse over one of the lines in the source window, and select a line that was marked in dark green. This means that it was executed by the tests. You will see a tooltip with a list of the tests that executed this line. To keep the tooltip short, there is a maximal number of tests to display there. To see a full list, click the line. Then the full information about the line is shown in the Explanation window.
Note: Lines in bright green were also executed, but not instrumented by Coco.
Patch file analysis
Consider the following scenario: In a large project, a last-minute patch has to be evaluated. There is not enough time to run the full test suite, but some risk assessment needs to be done. For situations like this, Coco provides the feature of patch analysis. With it, one can specifically display the code coverage for the changed lines of code, and find the tests in a large suite that cover them. One can now see how risky the changes are.
We will simulate this situation in our example. In a new version of the parser, the character classification functions in the code, isWhiteSpace(), isAlpha(), etc., have been changed and use the standard C classification functions, like isspace(), instead of strchr(). The new version of the parser can be found in the directory parser_v3.
We will now compare it with the version in parser_v2, but neither run the tests nor even compile it. Instead we need the following two pieces of information:
- The coverage data from
parser_v2, as generated in the previous section. - A patch file showing the differences between the two directories. There is already a diff file in the
parserdirectory that you can use,parser.diff.The diff file must be in the unified difference format. This is the standard output format of the
difffunctionality of many version control systems, e.g. ofgit diff(see Generation ofdifffiles). Under UNIX-like systems, the patch file can also be generated by thediffutility. It would be invoked from theparserdirectory in the following way:$ diff -u parser_v2 parser_v3 > parser.diffThere is also a Microsoft Windows version of GNU
diffin theparserdirectory, therefore the same command works in a Windows command shell too.
Start the CoverageBrowser. Then load the instrumentation database parser_v2/unittests.csmes via the menu entry File > Open, and the measurements file parser_v2/unittests.csexe with File > Load Execution Report.
Now select the menu entry Tools > Patch File Analysis. When the Patch File Analysis dialog appears:
- Enter a title in the Title box.
- Enter the path to the patch file in the Patch File box.
- Enter a path (including the file name) for the report in the Type box.
- Set the Tooltip Maximal Size to 5 (or any value greater than zero).
- Make any other option adjustments.
Then click Open to view the report in the browser.
The patch analysis report
The report consists of two tables, a list that summarizes the influence that the patch has on code coverage, and finally an annotated version of the patch file.
The two tables in the section Overview contain statistics about the number and kind of the lines that were influenced by the patch.
The first table groups the patched lines in the code by the results of the tests that executed them. One can see here how much influence the patch has on tests that have passed (and now could fail) or failed (and could now succeed). There are also entries for manually checked tests and for those whose status is unknown. In our example, we did not register the test results and all our tests are counted as Unknown.
The second table shows the kind of changes to expect in the test coverage after the patch has been applied. It consists of three columns, containing the statistics about removed and inserted lines and their sum. From the first two columns one can see whether the test coverage for the patched code grows or falls. (In the parser example, it stays the same.) The last line in the table is also important: It shows the number of lines which Coco could not classify as inserted or removed. Patch analysis is a heuristics, after all.
The section List of tests influenced by the modifications is a list of each test case that executed the patched code, together with its result. It is helpful for a qualitative analysis of the patch.
Coverage of the patched lines by the tests
More details can be found in the Patch File section of the report. It is an annotated version of the original patch file, with the old version of the text in red and the new version in green. Lines that did not change are shown in gray. The most important column is Tests, which shows for each code line the number of tests that executed it (if it is removed) or will probably execute it after the patch is applied. A tooltip shows the names of these tests.
Reverse patches
Now suppose that a patch has already been checked in. It has changed the application's behavior, and you want to write more tests to make sure that all new code has been covered. In this case, a reverse patch analysis is helpful.
To simulate a reverse patch analysis with the parser example, switch to the directory parser_v3 and compile the code there in the same way as before parser_v2. Then start the CoverageBrowser and load this time the instrumentation database parser_v3/unittests.csmes and the measurements file parser_v3/unittests.csexe. This can also be done on the command line, e.g. in the form
$ cd parser_v3
$ coveragebrowser -m unittests.csmes -e unittests.csexe
Generate the patch analysis report as before. Coco recognizes automatically that patch.diff is a patch to the current version of the program, and generates a corresponding report. This patch report contains the same data as the report for the forward patch, but the headers have changed to reflect the new interpretation.
Bug location
CoverageBrowser can compute the probable location of an error in the source code by comparing the coverage data of all tests that were run on a program.
The algorithm expects that at least one test had failed. In our example, the parser does not detect that the exponent of a floating point number is invalid. It is possible to write the following:
$ cd parser_v2
$ ./parser
Enter an expression an press Enter to calculate the result.
Enter an empty expression to quit.

> 1E+
        Ans = 1
But 1E+ is not a valid number because it has no digits after the +.
To find out which line in the source code causes this, we need a few additional tests. The following tests are already part of the test suite in the file unittests.cpp:
| Test input | Expected result | Execution status |
|---|---|---|
| 1.1 | 1.1 | Passed |
| 1.1e1 | 11 | Passed |
| 1.1e+1 | 11 | Passed |
| 1.1e-1 | 0.11 | Passed |
| 1.1e+ | error message | Failed |
With these tests already contained in the test suite, we can use CoverageBrowser to find a candidate for the line that caused the bug. There is a Bug Location window in the CoverageBrowser, but it is by default hidden. You can show it by checking the field Bug Location in the menu View.
After the window is shown, select all the executions in the Executions window and click the Compute button. The window will then be filled with a list of possible bug locations, with the most probable (according to Coco) first. In our case there is only one candidate: Line 263 of the file parser.cpp. This line is the location where the sign + of the exponent is parsed.
At this point a fix could be implemented, but since this is only a demonstration, we will not do it here.
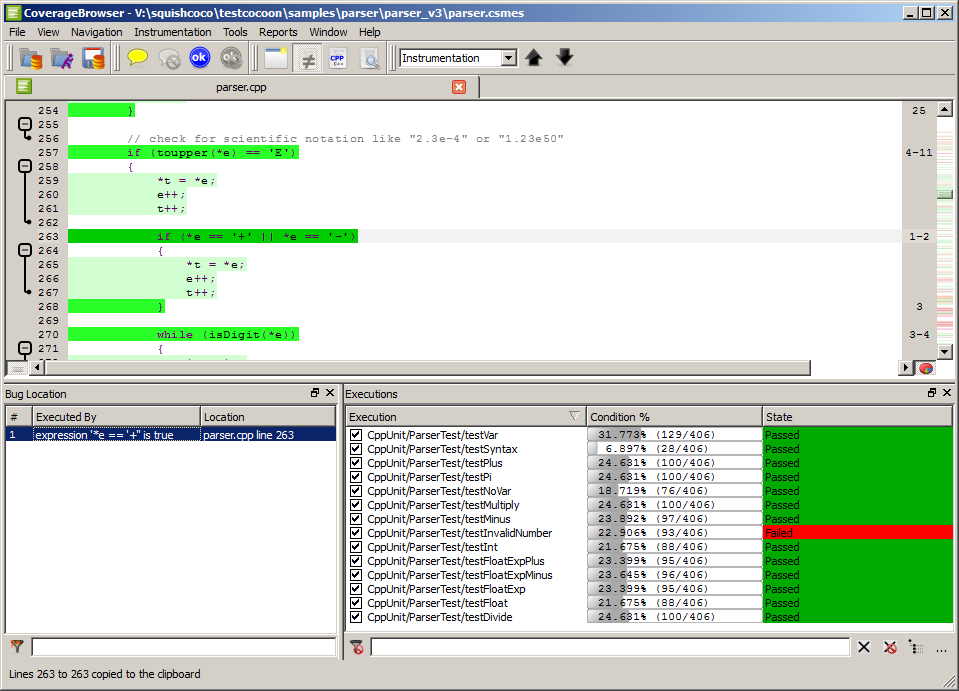
Bug location for the parser sample
The function profiler
With the function profiler, Coco measures for all functions in a program how much time they require when the program is executed.
The function profiler is disabled by default. To switch it on, one needs the CoverageScanner option --cs-function-profiler in the compiler and linker command line arguments.
Note: The function profiler does not work on all Unix systems and is therefore disabled in the instrumented scripts. To enable it, the comment sign at the beginning of the line that sets the flag --cs-function-profiler must be removed.
As it is possible with code coverage, one can use the CoverageBrowser to measure the time consumption of a selected set of executions. One can also use it to compare the time measurements for two program versions or two test executions.
Basic use
In the parser example, function profiling is already enabled. For a simple example, run the unit tests in the parser_v3 directory and load the instrumentation database into the CoverageBrowser. A profiler docking window will then be shown. If it is not shown, select the menu entry View > Function Profiler. When no tests are selected, it contains only a list of the functions for which the execution time is recorded:
![]()
The profiler window when no tests are selected
Once a test is selected, the timing information of the functions appears:
- Total Duration: The accumulated execution time of the function.
- Count: The number of calls.
- Mean Duration: The mean execution time of a single call.
All timing information refers to the selected executions. Click the title bar of a column to sort it and to find the highest values.
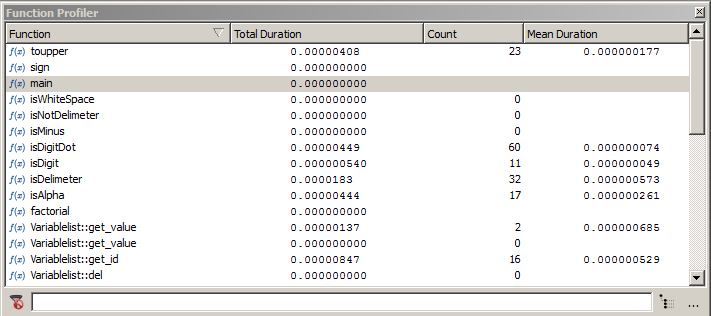
The profiler window when tests are selected
Comparing two sets of executions
CoverageBrowser can also compare the profiling information of two sets of tests. The principle is simple: a set of reference functions is selected and compared to another set.
Activate the execution comparison mode by selecting the menu entry Tools > Execution Comparison Analysis. A column Reference will then appear in the Executions window. Select as reference the test CppUnit/ParserTest/testFloatExp and as selected execution CppUnit/ParserTest/testFloat.
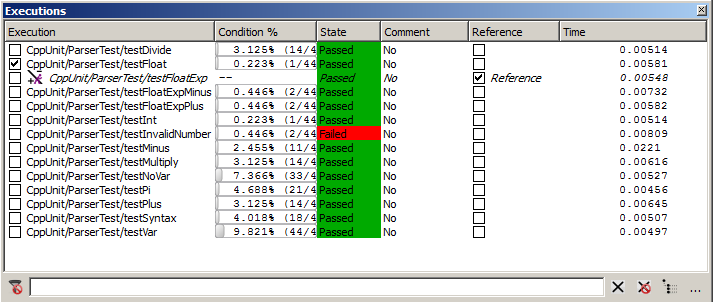
Executions window in test comparison mode
Use the context menu to show the columns Total Duration (Ratio) and Total Duration (Difference). Click the column Total Duration (Ratio) to sort it. You should get a screen equivalent to the following screenshot. The timing information may differ from that on the image because the execution time depends on the machine which runs the tests.
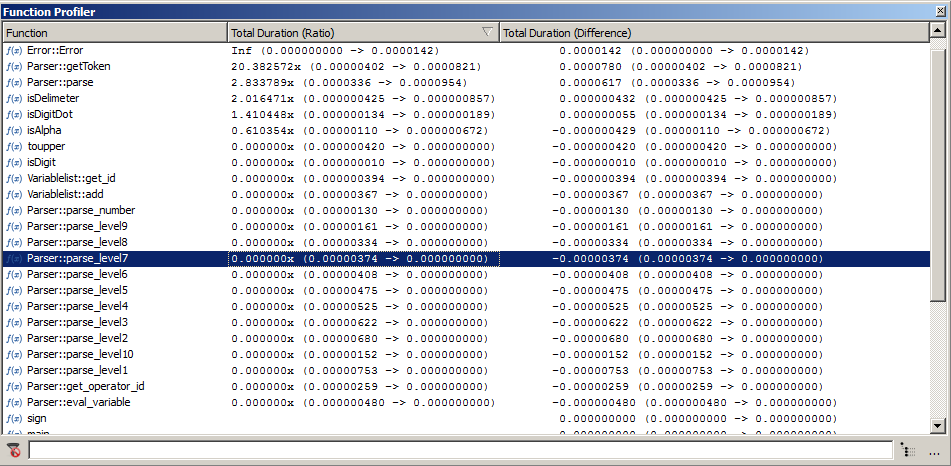
Profiler window in test comparison mode
The entries in the table have the form <ratio> (<reference>-><selected>) and <diff> (<reference>-><selected>). In them, <reference> is the runtime of the function in the reference execution and <selected> the runtime of the selected executions taken together. <ratio> is their quotient and <diff> is their difference.
We can see that the function Error::Error has an infinite ratio because it was not executed in the reference test. We can also see that that the function Parser::getToken is 20 times slower than the reference test. The entry in the Difference column is however not really meaningful because the difference is only 78 microseconds.
Comparing two versions of a program
It is also possible to compare the execution times of two different versions of the same program.
Note: This requires that the .csexe data are already incorporated into their .csmes files. If you have not done this already, open parser_v2/unittests.csmes and parser_v2/unittests.csexe into the CoverageBrowser, select File > Save, and then to the same with parser_v3.
To do this, select the reference execution database with Tools > Compare with. In the resulting file selection dialog, choose the file parser_v2/unittests.csmes.
Since the absolute names of the source files are not identical, it is necessary to rename them first. In the Source window, select the context menu by a right mouse click and in it, Rename Sources. As current name enter parser_v2 and as new name parser_v3 and then press Ok.
Now select all executions in the Execution window. Then CoverageBrowser compares the two program versions in the same way as the two program executions in the previous section.
Profiler window when comparing two software versions
Using the function profiler for performance improvements
This section is an example how Coco can be used to find and resolve performance problems. It covers narrowing down the performance issues, identifying problematic functions, rewriting the source code and comparing the refactored code's performance to the original version.
Application building
To enable the profiler, CoverageScanner needs a flag, --cs-function-profiler.
Two versions are available:
--cs-function-profiler=all: Profile all functions.--cs-function-profiler=skip-trivial: Skip functions with only a single statement.These functions are mostly getter or setter functions. Profiling them would only slow down the program without providing more information.
With these options, Coco collects the profiling together with the code coverage. No additional work is necessary to analyze the results with the CoverageBrowser.
Note: The function profiler does not work on all platforms (see here) and is therefore disabled in the instrumented scripts. To enable it, remove the comment sign at the beginning of the line that sets the flag --cs-function-profiler=all.
Analyzing performance issues
Identifying test cases
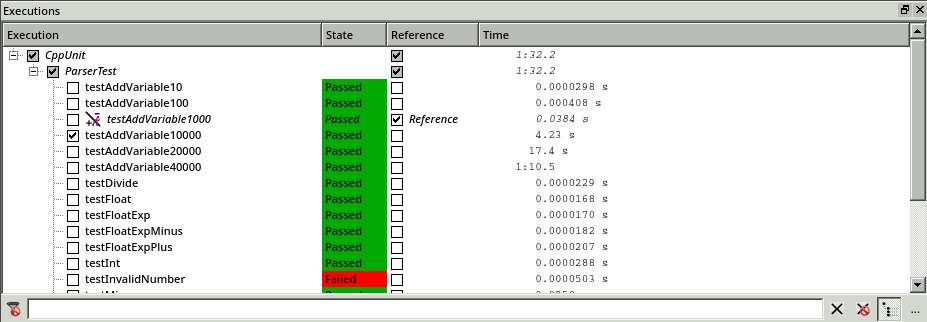
Now load the files unittests.csmes and unittests.csexe into the CoverageBrowser. In the Executions window we see that some tests executions required a large amount of time:
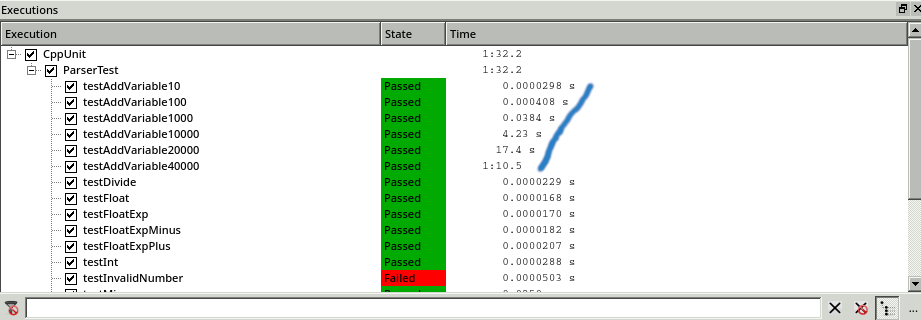
Identifying tests which have performance issues.
In these tests, new parser variables are defined, from 10 in testAddVariable10 up to 40 000 new variables in testAddVariable40000. We can see that the time spent in these tests increases exponentially with the number of variables.
To analyze the situation, we use the execution comparison mode in the CoverageBrowser. To activate it, we use the menu entry File > Execution Comparison Analysis. We select the test with 1000 variable definitions as a reference test and compare it with the test with 10 000 definitions.
Comparing the tests with 1000 variable definitions to the test with 10 000 variable definitions.
Identifying problematic functions
The Function Profiler window makes a more detailed analysis possible:
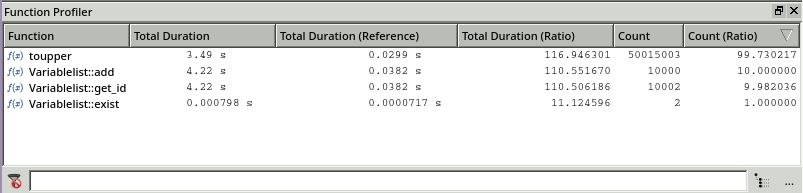
Comparison using the Function Profiler window.
This window displays the execution time and number of calls for the test with 10 000 variables and the reference test with 1000 variables.
Additionally, there are two columns for the ratio of the current test to the reference. The content of the column Total duration (Ratio) is given by the formula:
ratio = duration of test_current / duration of test_reference
There is a similar formula for the column Count (Ratio).
With this information it is easy to see that if the number of variable definitions in a test grows by a factor of 10, the execution times of toupper(), Variablelist::add() and Variablelist::get_id() grow by a factor of over 100. Furthermore, it seems to be necessary to reduce the number of calls of toupper() because its number of executions increases by a factor of 99 whereas the number of executions for the other functions grow by a factor that is smaller than 10.
Next we look at the code for these functions. (It is in the file parser_v3/variablelist.cpp.) We see a typical example of source code that was originally written in C: The code uses char* as the string data type, and the variables and their values are stored as an array of structs. STL containers are used but just to replace the classic C arrays. The function get_id() finds the position of an entry for a variable by iterating over the complete table of variables. The number of search steps is therefore proportional to the number of variables in the table, but it could be logarithmic if it were replaced by a linear search. There is also a call of toupper() in each iteration that slows down the algorithm even more.
    /*
     * Add a name and value to the variable list
     */
    bool Variablelist::add(const char* name, double value)
    {
        VAR new_var;
        strncpy(new_var.name, name, 30);
        new_var.value = value;

        int id = get_id(name);
        if (id == -1) {
            // variable does not yet exist
            var.push_back(new_var);
        }
        else {
            // variable already exists. overwrite it
            var[id] = new_var;
        }
        return true;
    }

    /*
     * Returns the id of the given name in the variable list. Returns -1 if name
     * is not present in the list. Name is case insensitive
     */
    int Variablelist::get_id(const char* name)
    {
        // first make the name uppercase
        char nameU[NAME_LEN_MAX+1];
        char varU[NAME_LEN_MAX+1];
        toupper(nameU, name);

        for (unsigned int i = 0; i < var.size(); i++) {
            toupper(varU, var[i].name);
            if (strcmp(nameU, varU) == 0) {
                return i;
            }
        }
        return -1;
    }

    /*
     * str is copied to upper and made uppercase
     * upper is the returned string
     * str should be null-terminated
     */
    void toupper(char upper[], const char str[])
    {
        int i = -1;
        do {
            i++;
            upper[i] = std::toupper(str[i]);
        } while (str[i] != '\0');
    }
Rewriting the source code
We replace the array of struct with a std::map. The updated code (in parser_v4/variablelist.cpp) is then:
std::map<std::string, double> var;

bool Variablelist::add(const char* name, double value)
{
    var[ toUpper( name ) ] = value ;
    return true;
}

bool Variablelist::set_value(const char* name, const double value)
{
    return add(name, value);
}

std::string toUpper(const char str[])
{
    std::string upper;
    upper.reserve(NAME_LEN_MAX);
    int i = -1;
    do {
        i++;
        upper += std::toupper(str[i]);
    } while (str[i] != '\0');
    return upper;
}
Here toupper() is rewritten for std::string and the function add() is only a simple affectation of std::map, which has a logarithmic complexity.
Comparing the results
Now we can re-execute the tests with the program version in parser_v4 and compare the results. We open the CoverageBrowser, load the latest version of parser_v4/unittests.csmes and compare it with the previous one. The comparison is done the same way as in the previous section (see Comparing two versions of a program), except that it is now with parser_v3 and parser_v4.
In the Executions window of CoverageBrowser we see that the speed issue is resolved. The execution time of the tests no longer grows exponentially.
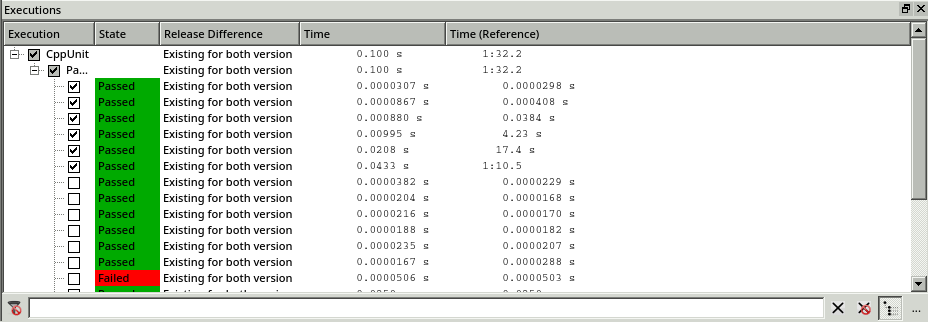
Execution of the test suite in both software versions.
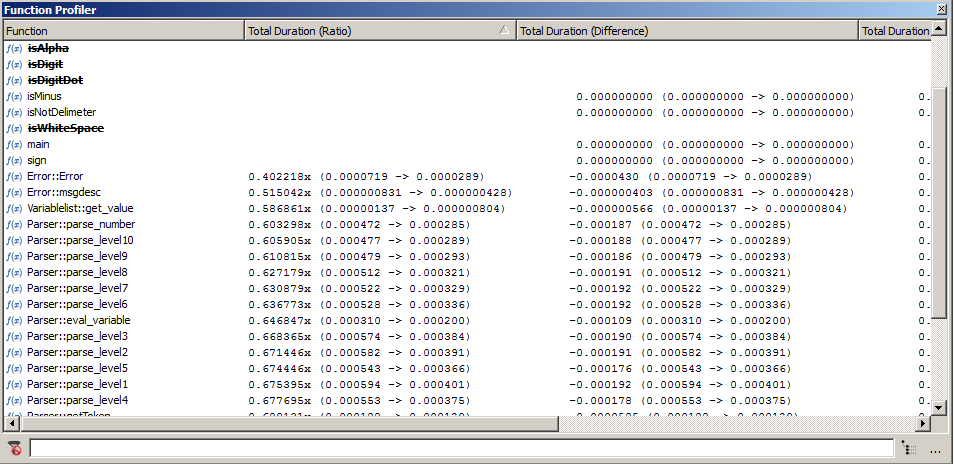
The Function Profiler window confirms this finding. Coco highlights the modified functions in bold, underlines the new functions and strikes out the removed functions. Now, by measuring the difference of the execution time (1 minute and 32 seconds), we can see that the performance gain is nearly the same as the previous execution time.
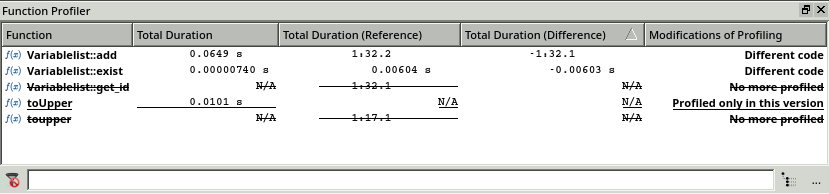
Comparing the profiler data in the Function Profiler window.
Coco v7.5.1 ©2026 The Qt Company Ltd.
Qt and respective logos are trademarks of The Qt Company Ltd. in Finland and/or other countries worldwide. All other trademarks are property
of their respective owners.
