Support for Other IDEs and Toolchains
This chapter is about specialized IDEs and build systems, most of them for embedded systems.
CygWin
To install the CoverageScanner compiler wrapper for GCC and G++ on CygWin:
- Open the Build Environment Selection application (<Windows Coco>
\toolselector.exe). - Select the item CygWin - www.cygwin.com.
- Click Install CygWin Support. The build environment selection dialog then displays the list of generated compiler wrappers.
Open then the CygWin console and compile your application with csgcc instead of gcc (or csg++ instead of g++).
Scratchbox
If Coco is installed on the root file system, a compiler wrapper is created for each compiler supported by Scratchbox. To invoke CoverageScanner, prepend cs to the name of the cross-compiler.
Note: Installation option: 1) Installation on the local machine (need to be root).
TI C6000 CGT6
There is no standard location to install this compiler. However, TI compiler Coco wrappers are installed in %squishcoco%\TI.
To instrument programs that are built with the TI cl6x compiler, you must either
- Add the Coco compiler wrappers to your PATH (before the actual compiler), or
- run the Build Environment Selection, which, when given an install location of the TI compiler, will move the original executables to a different directory and place wrappers in the original location.
With the second approach, the wrappers will simply pass on the command line arguments to the underlying compilers unless --cs-on is passed as a command line argument or found in the COVERAGESCANNER_ARGS environment variable, in which case, Coco instrumentation happens.
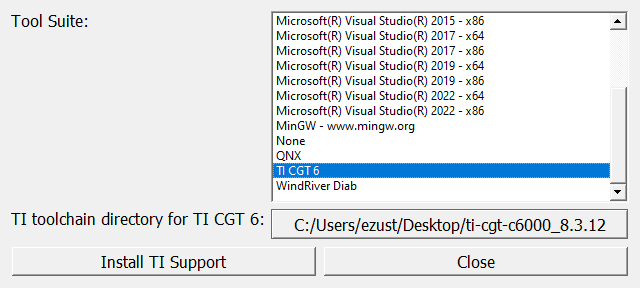
To install CoverageScanner compiler wrapper for the TI C6000 cl6x toolchain:
- Open the Build Environment Selection application (%squishcoco%
\toolselector.exe). - Select the item TI CGT 6.
- Select the directory to which the TI CGT 6 compiler is installed installed (for example,
C:\Desktop\TI). - Click Install TI Support and wait for the confirmation that the tools are generated.
Synopsys Metaware Designware ARC
There is no support for Metaware compilers yet in the Build Environment Selection, so don't bother looking for Metaware there. However, Squish Coco provides wrappers for 2 Metaware compilers: ccac and arac.
After the Metaware compiler is installed on Windows, an environment variable, METAWARE_ROOT is defined, and the compiler is installed below that directory. The installer adds these directories to your PATH: %METAWARE_ROOT%\arc\bin;%METAWARE_ROOT%\ide.
For it to be possible to instrument your builds, add the directory of the Coco Metaware wrappers to the start of your PATH. If you are using the command shell, it looks like this:
set PATH=%squishcoco%\Metaware;%PATH%To instrument programs with one of our compiler wrappers, add --cs-on and whatever other coveragescanner arguments you like to the COVERAGESCANNER_ARGS environment variable.
set COVERAGESCANNER_ARGS=--cs-on --cs-mcdcAfter that, you can run gmake from the command line to build your application, and you should get an instrumented build.
Alternately, from the Metaware IDE, you can set these environment variables from Project - Properties - C/C++ Build - Environment.
To setup code coverage for a project, go to Manage Configurations - New and create a new configuration called CodeCoverage. Select it, and set it to Active.
Next, set the PATH and the COVERAGESCANNER_ARGS in the Environment section.
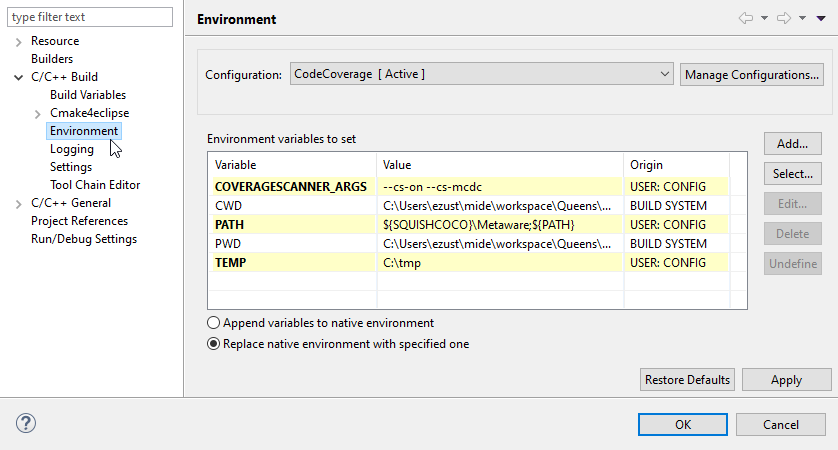
After this, the IDE should be able to build instrumented executables of your project.
If you no longer want code coverage, switch back to one of the previous build configurations.
ARM Keil μVision
To enable the code coverage analysis, compile the project with Coco compiler wrapper for ARM and enable the code coverage analysis during the compilation:
- To install CoverageScanner compiler wrapper for the ARM® Keil® μVision toolchain:
- Open the Build Environment Selection application (<Windows Coco>
\toolselector.exe). - Select the item ARM-Keil.
- Select the directory to which the ARM Keil μVision compilers are installed (for example,
C:\Keil_v5\ARM). - Click Install ARM-Keil Support and wait for the confirmation that the tools are generated.
- Open the Build Environment Selection application (<Windows Coco>
- Activate the code coverage analysis during the compilation:
- Click Project > Option for Target.
- On the C/C++ tab, add
--cs-oninto the Misc Controls field.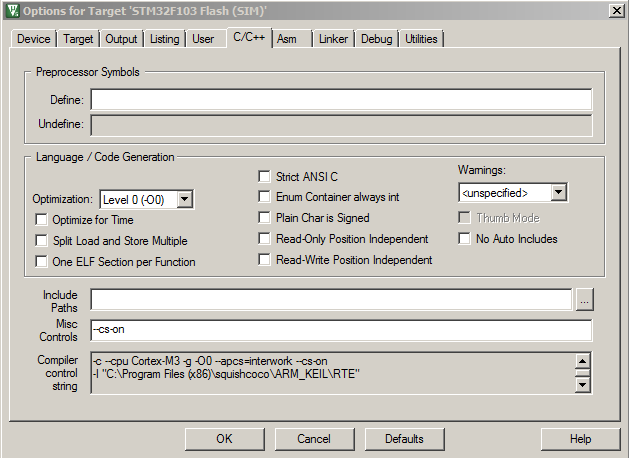
- On the Linker tab, add
--cs-oninto the Misc Controls field.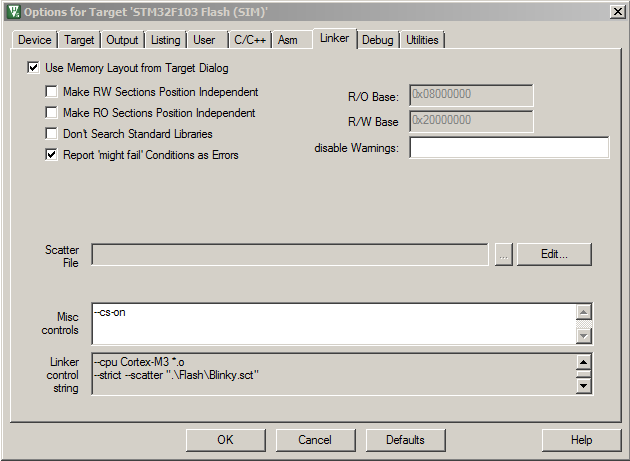
Arm DS
To enable the code coverage analysis for an Arm DS project, compile it with Coco compiler wrapper for ARM and enable the code coverage analysis during the compilation:
- To install CoverageScanner compiler wrapper for the Arm DS toolchain:
- Open the Build Environment Selection application (<Windows Coco>
\toolselector.exe). - Select the item ARM-DS.
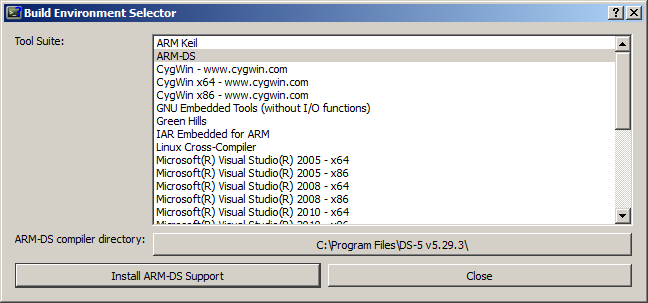
- Select the directory o which the Arm DS compilers are installed (for example,
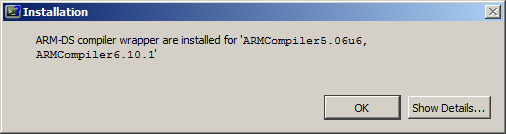
C:\Program Files\DS-5 v5.29.3) - Click Install ARM-DS Support and wait for the confirmation that the tools are generated.
- Open the Build Environment Selection application (<Windows Coco>
- Activate the code coverage analysis during the compilation:
- Click Project > Properties.
- On the Arm C/C++ Compiler 5 tab, add
--cs-oninto the Miscellaneous field.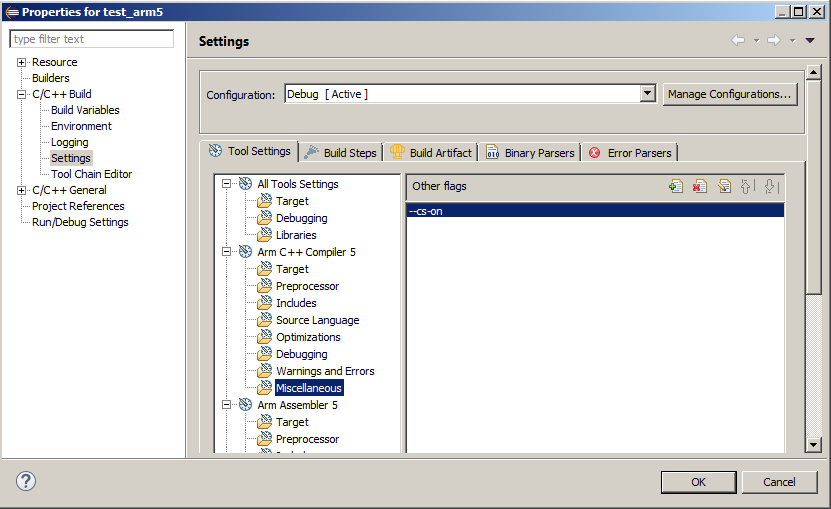
- On the Arm Linker 5 tab, add
--cs-oninto the Misc Controls field.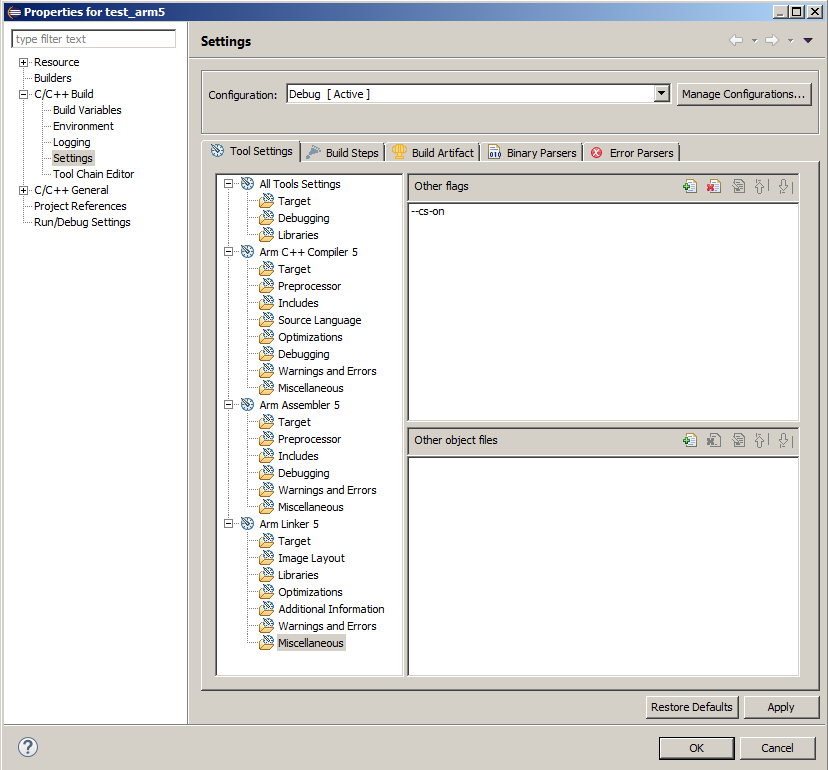
To upload the coverage data from the target to the host, define some custom I/O functions and trigger the coverage generation by calling __coveragescanner_save(). Due to the fact that Arm DS supports semi-hostings extensions, the simplest way is to use it to generate the execution report directly on the host file system.
For that modify the main() function to add a call to __coveragescanner_set_custom_io(), __coveragescanner_filename() and __coveragescanner_save() as in the following sample:
#include <stdio.h>

#ifdef __COVERAGESCANNER__
static int csfputs(const char *s, void *stream)
{
  return fputs(s, (FILE *)stream);
}

static void *csfopenappend(const char *path)
{
  return (void*)fopen(path,"a+");
}

static int csfclose(void *fp)
{
  return fclose((FILE*)fp);
}
#endif

int main() {
#ifdef __COVERAGESCANNER__
  __coveragescanner_set_custom_io( NULL,
      csfputs,
      csfopenappend,
      NULL,
      NULL,
      csfclose,
      NULL);
  __coveragescanner_filename( "c:\\tmp\\test_arm5_csexe" ); /* destination file on the host file system */
#endif
  .......
#ifdef __COVERAGESCANNER__
    __coveragescanner_save(); /* saves the execution report */
#endif
        return 0;
}
The project can now be rebuilt and a project file with the extension .afx.csmes will be generated. This file can be opened in CoverageBrowser. Execute then the target application and wait until __coveragescanner_save() is called. A file c:\tmp\test_arm5_csexe will be generated (hard coded in our sample). Import and analyze it using CoverageBrowser as in the following screenshot:
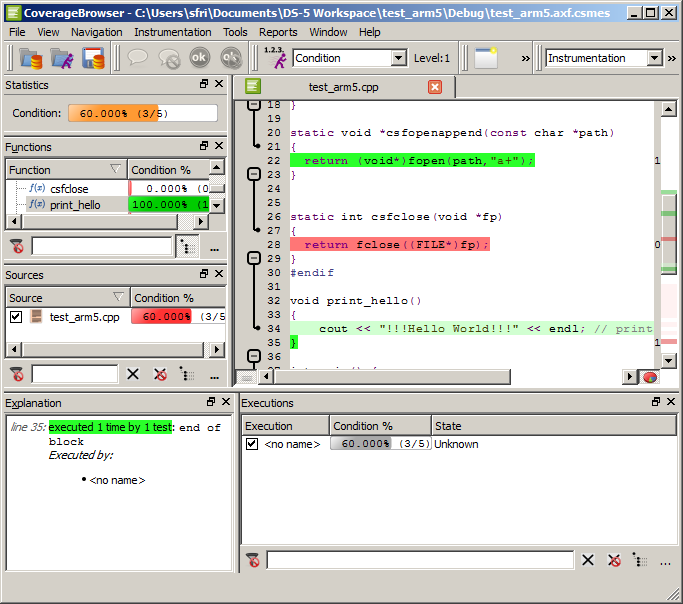
Code coverage of an Arm DS project
Note: The extension of an execution report is usually .csexe but the semi-hosting implementation provided by ARM removes the file extensions. It is necessary to remove the default file filter in the import dialog of CoverageBrowser to be able to import it.
Green Hills Software MULTI Launcher
Installation
To install CoverageScanner compiler wrapper for the Green Hills® Software toolchain:
- Open the Build Environment Selection application (<Windows Coco>
\toolselector.exe). - Select the item Green Hills.
- Select the directory to which the Green Hills Software compilers are installed.
- Click Install Green Hills Support and wait for the confirmation dialog the tools are generated.
Command line tools
The command line tools for the Green Hills Software compiler are installed in the folder squishcoco of the installed native toolchain. For example, if the native toolchain is installed under c:\ghs\comp_201426, the Coco compiler wrappers are installed under c:\ghs\comp_201426\squishcoco.
The compiler wrappers completely replace the Green Hills Software toolchain. To activate the code coverage analysis, add the parameter --cs-on to the compiler arguments.
CoverageScanner library
To save an execution report:
- Provide to the CoverageScanner library a list of I/O functions which let you upload the coverage information to the host.
- Save manually the coverage report on a specific trigger.
To save a coverage report, use the following code snippet (add this code in an event handler which should trigger the report generation):
#ifdef __COVERAGESCANNER__
    __coveragescanner_save();
    __coveragescanner_clear();
#endif
To provide the I/O functions, call __coveragescanner_set_custom_io() in the main() function of the application. At least three functions need to be provided by __coveragescanner_set_custom_io():
- An equivalent function of
fopen()which opens the execution report file (with the extension.csexe) in append mode. - An equivalent function of
fclose(). - An equivalent function of
fputs()to transfer the contents.
For example, the following code writes an execution report to the local file system using the C file API.
#ifdef __COVERAGESCANNER__
static int csfputs(const char *s, void *stream) { return fputs(s, (FILE *)stream); }
static void *csfopenappend(const char *path)    { return (void*)fopen(path,"a+");  }
static int csfclose(void *fp)                   { return fclose((FILE*)fp);        }
#endif

int main()
{
#ifdef __COVERAGESCANNER__
    __coveragescanner_set_custom_io( NULL,
            csfputs,
            csfopenappend,
            NULL,
            NULL,
            csfclose,
            NULL);
#endif
....
}
QNX Software Momentics IDE
Installation
To install CoverageScanner compiler wrapper for the QNX® Software toolchain:
- Open the Build Environment Selection application (<Windows Coco>
\toolselector.exe). - Select the item QNX.
- Select the directory on which the QNX Software toolchain is installed. By default, it is
c:\Users\<account>\qnx700. - Click Install QNX Support and wait for the confirmation that the tools are generated.
Configuration
Once the installation process is done, activate and configure the Coco parameters for a selected build mode. Or create a dedicated mode just for the code coverage, which is a better practice.
QNX Software 7.0
Proceed as follows:
- Open QNX Momentics IDE.
- Load the project to instrument.
- Open the project's preferences with the menu Project > Properties.
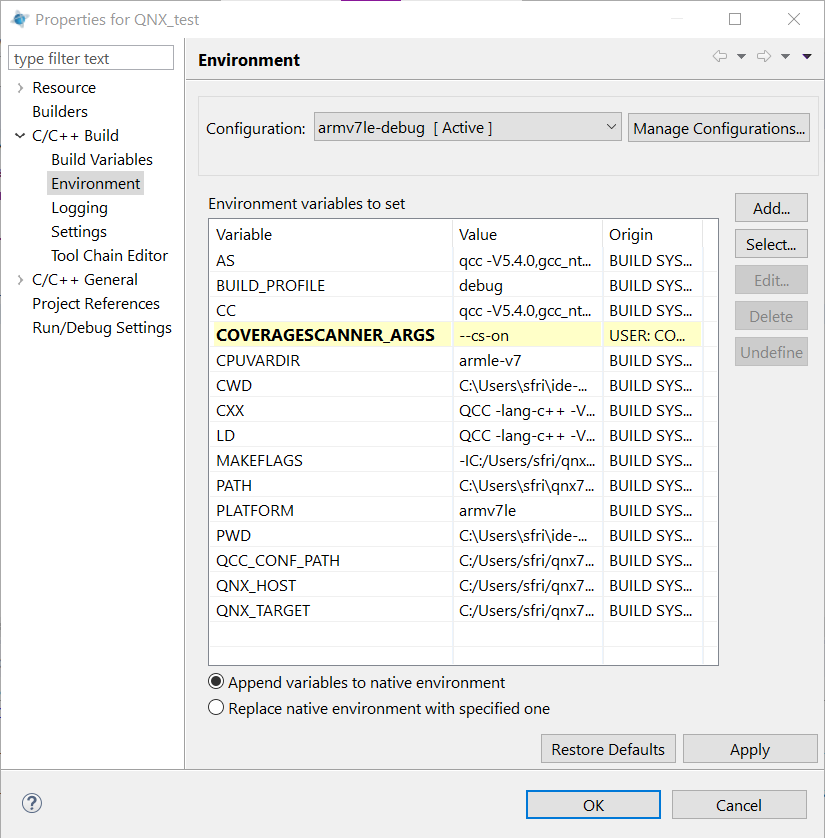
- Select C++ Build > Environment and add the variable
COVERAGESCANNER_ARGSwith the value--cs-on. You can specify additional settings. For example, to enable the MC/DC instrumentation, add--cs-mcdc. - Rebuild your project to find in your build folder the instrumentation database
<project_name>.csmes. You can then execute your application and import the generated.csexefile into it.
QNX Software 7.1
Proceed as follows:
- Open QNX Momentics IDE.
- Load the project to instrument.
- Open the project's preferences with the menu Project > Properties.
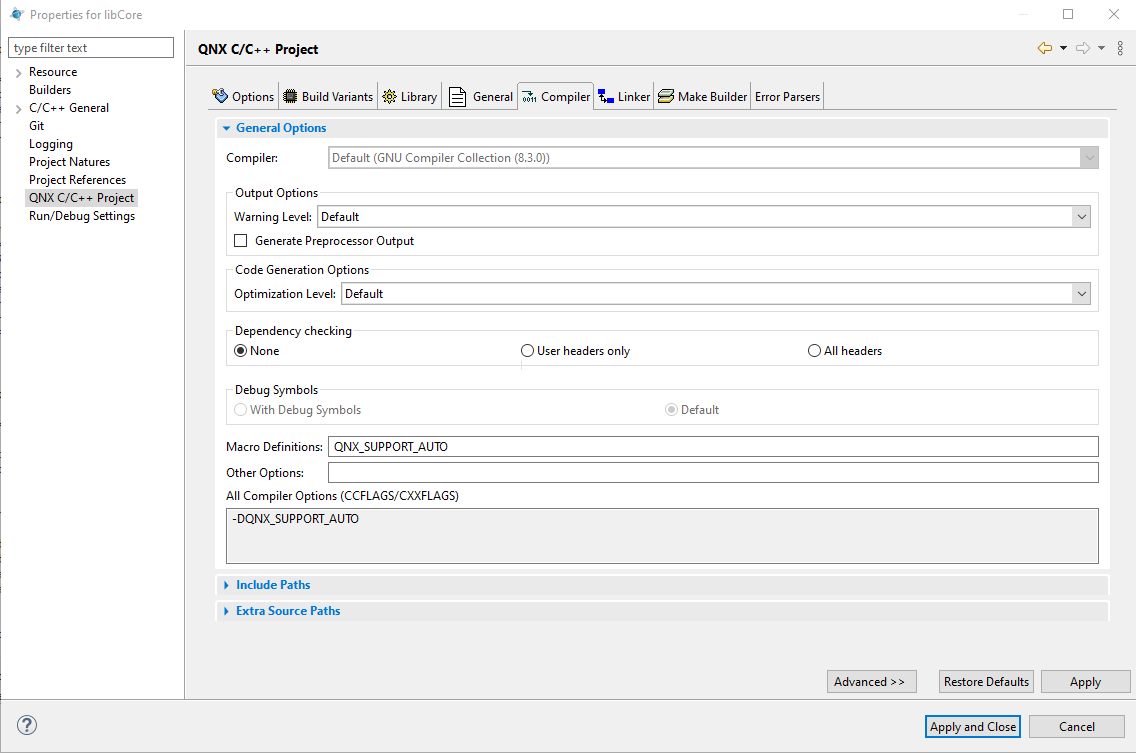
- Select QNX C/C++ Project > Compiler, and in Other Options enter
--cs-on. To enable the MC/DC instrumentation add also--cs-mcdc. - Select QNX C/C++ Project > Linker, and in Other Options enter
--cs-on. - Rebuild your project to find in your build folder the instrumentation database <project_name>
.csmes. You can then execute your application and import the generated.csexefile into it.
Instrumenting without modifying the project
To instrument a QNX Software Momentics project without modifying it, create a small batch file which sets the variable COVERAGESCANNER_ARGS and start the IDE.
For example:
set COVERAGESCANNER_ARGS=--cs-on
C:\QNX\QNX_Momentics_IDE\qde.exe
Then rebuild the project to instrument it.
VxWorks support on Linux
To activate Coco on Wind River's Workstation:
- Start Wind River's Workbench
- Select your project in the Project Explorer window and click on the entry Properties in the context menu.
- Select the build properties, the compiler toolchain, and click on the Variables tab.
- Search for the
TOOL_PATHvariable and replace the/binstring at the end with/squishcoco: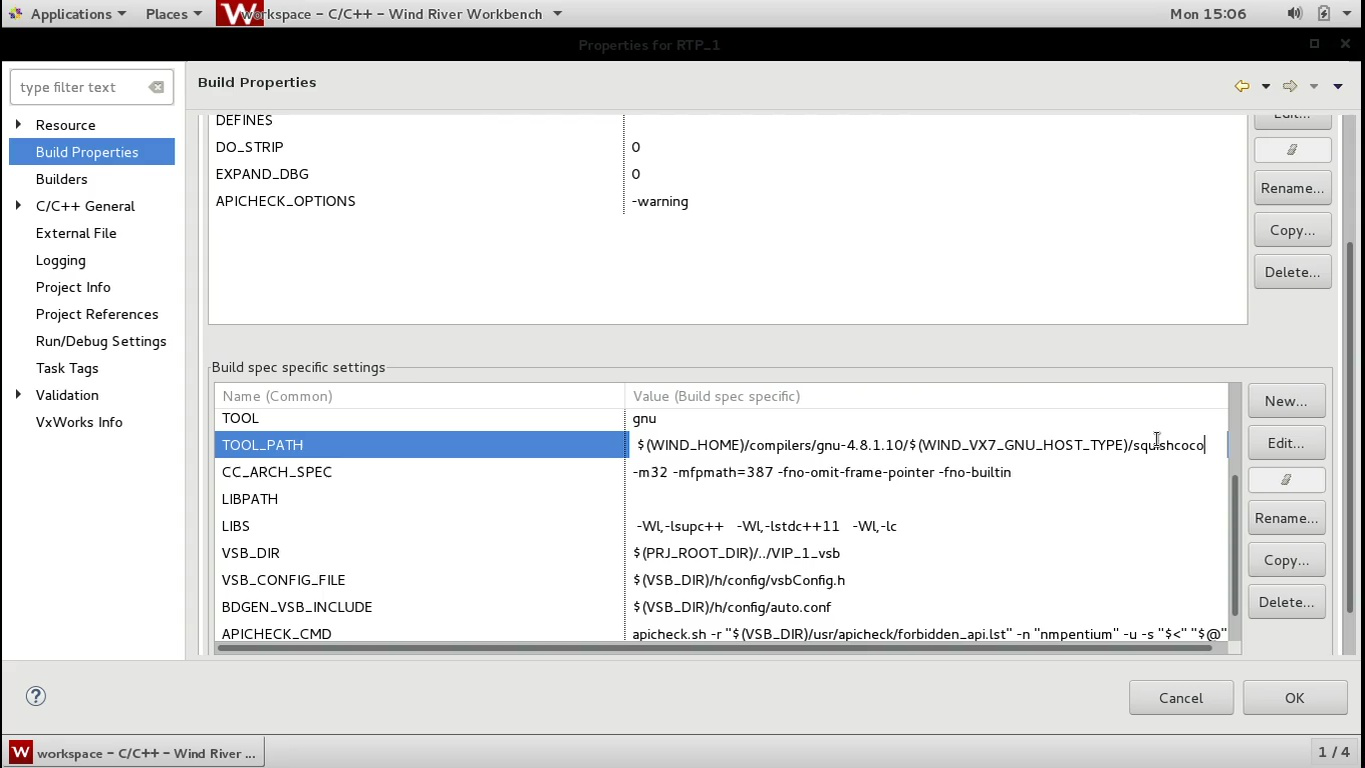
After this change, the project can be compiled with CoverageScanner or the native toolchain. To use CoverageScanner, add the option --cs-on to the command line arguments of the compiler and the linker:
- Start the Wind River Workbench
- Select your project in the Project Explorer window and click Properties of the context menu.
- Select the build properties, the compiler toolchain, and click on the Tools tab.
- Select the entry C-Compiler in the Build Tool combo box and add to the content of the Tool Flags field the argument
--cs-on: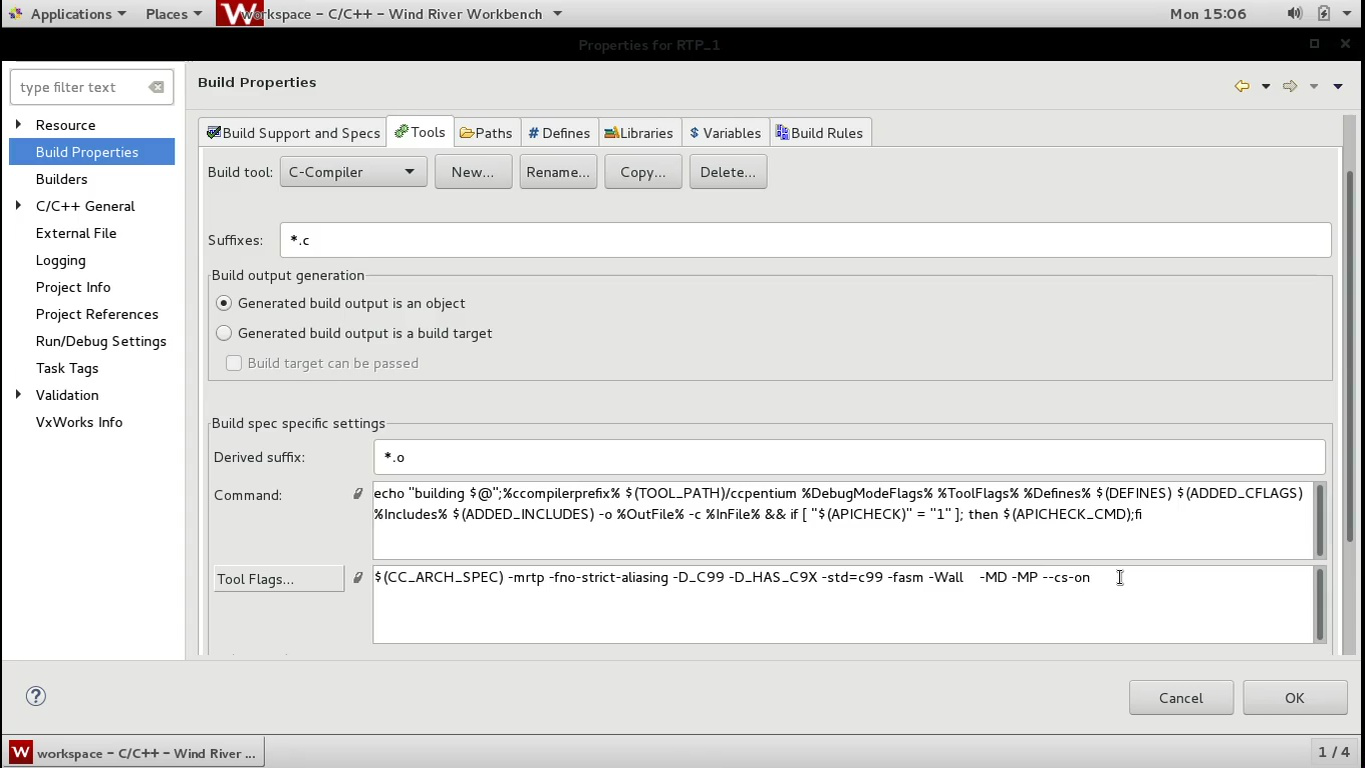
- Do the same for the C++-Compiler and the Linker tool.
With these settings, a file with the extension .vxe.csmes is generated when the code is compiled. It contains the complete instrumented code and can be inspected with CoverageBrowser. The resulting target application will then create a file with the suffix .csexe after it has run.
This file is created on the target file system. It can then be transferred to the host and imported into the .vxe.csmes file to create a report.
A video that illustrates the content of this chapter is available on https://youtube.com/watch?v=bMxMV6qHsYU.
LLVM Clang
The LLVM toolchain should already be installed. Execute the Build Environment Selection program after the installation of Coco. You can find it in the Coco installation folder with the name toolselector.exe.
In the main window, select the correct installation folder for your LLVM binary folder and click Install LLVM Support:
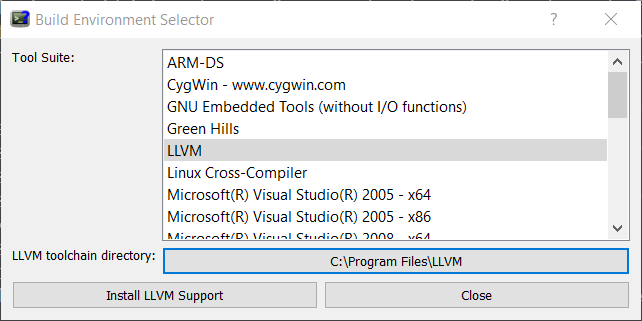
After the installation, the Clang compiler supports CoverageScanner's command line arguments (--cs-on, --cs-hit, --cs-mcdc, and so on) and can be used to instrument C/C++ code.
IAR Embedded Workbench
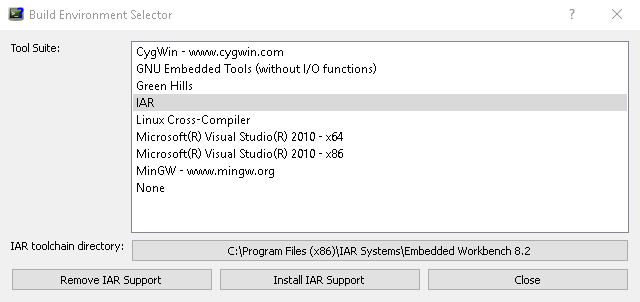
Only Windows OS supported. The IAR Embedded Workbench should already be installed. Execute the Build Environment Selection program after the installation of Coco. You can find it in the Coco install folder with the name toolselector.exe.
In the main window, select the correct installation folder for your IAR binary folder and click Install IAR Support:
The next step is to adjust your Embedded Workbench to execute Coco. Do this by clicking Extra Options in the project settings in Project > Options > C/C++ Compiler > Extra Options:
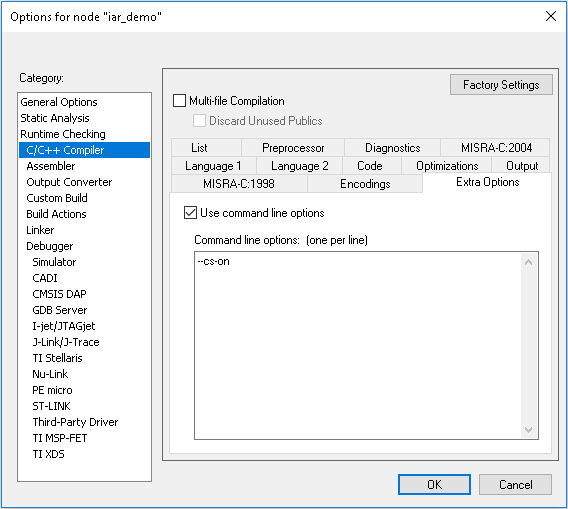
Enable the checkbox and type --cs-on into the field. Also add this to the linker by selecting Project > Options > Linker > Extra Options:
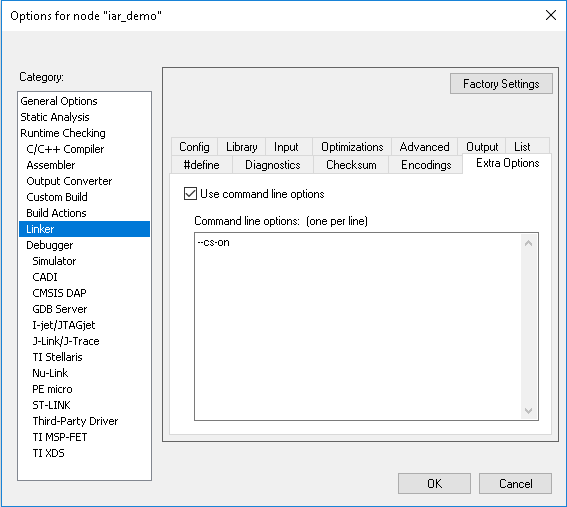
Enable the checkbox and type --cs-on into the field. To deactivate Coco, just uncheck the two checkboxes again.
TASKING support
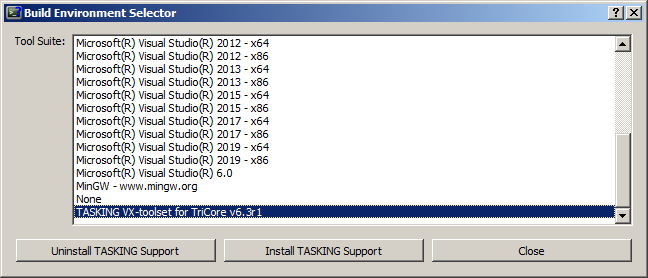
The TriCore Eclipse IDE from TASKING should already be installed. Execute the Build Environment Selection program after the installation of Coco. You can find it in the Coco install folder with the name toolselector.exe. In the main window, select TASKING VX-Toolset for TriCore, and click Install TASKING Support:
The next step is to activate the code coverage support in the Eclipse IDE. Open TriCore Eclipse IDE, click the top of your project and in the context menu, select Properties.
In the project's configuration dialog, select C/C++ Build > Settings. The complete compiler and linker settings will be displayed. Select C/C++ Compiler > Miscellaneous. You should see then an additional argument as in the following screenshot:
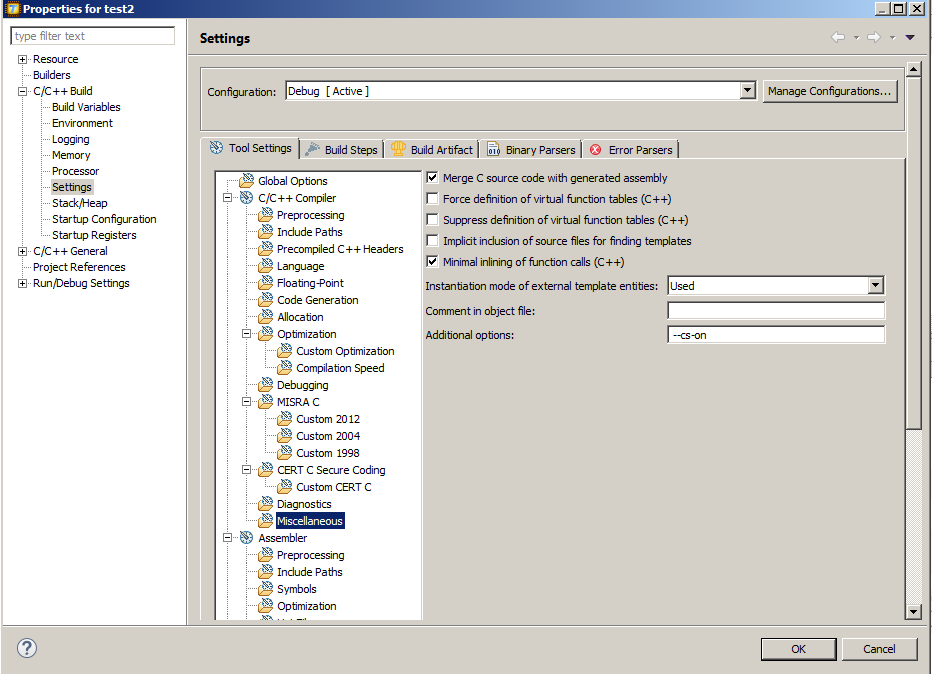
Add --cs-on to enable the code coverage analysis for the compiler.
Then do the same for the linker, select Linker > Miscellaneous, and add --cs-on to the additional arguments:
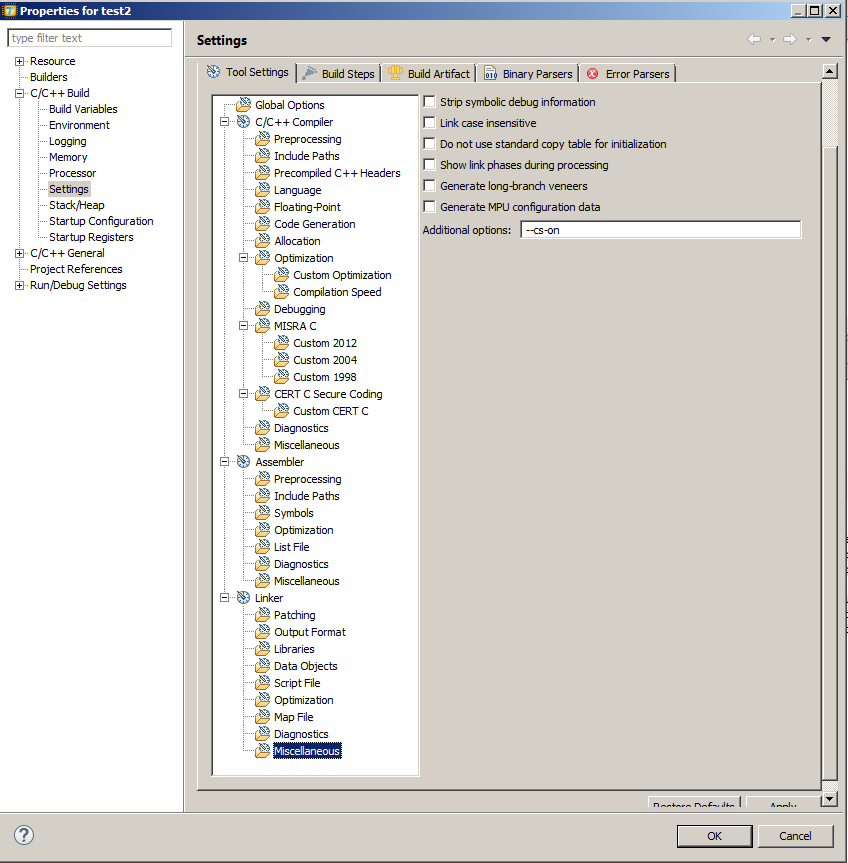
To instrument the embedded application, rebuild it. A .csmes file is generated upon the compilation.
But to see the coverage, it is necessary to provide a set of functions that permit uploading it to the host. The TASKING simulator supports ARM's semi-hosting function which permits writing to files directly from the target to the host's file system. You can use this to generate the execution report (.csexe file) but on real hardware, it may be necessary to use other implementations.
For the setup, add the following lines to the source containing the main function:
#include <stdio.h>

#ifdef __COVERAGESCANNER__
static int csfputs(const char *s, void *stream)
{
  return fputs(s, (FILE *)stream);
}

static void *csfopenappend(const char *path)
{
  return (void*)fopen(path,"a+");
}

static int csfclose(void *fp)
{
  return fclose((FILE*)fp);
}
#endif
Then in the first lines of the main() function, configure these functions as handlers:
int main( int argc, char *argv[] )
{
#ifdef __COVERAGESCANNER__
    __coveragescanner_set_custom_io(
        NULL,
        csfputs,
        csfopenappend,
        NULL,
        NULL,
        csfclose,
        NULL
        );
#endif

    ......
}
Then, at the location where the execution report should be saved, add the following lines:
#ifdef __COVERAGESCANNER__
    __coveragescanner_save();
#endif
VisualDSP
To enable the code coverage analysis, compile the project with a Coco compiler wrapper and enable the code coverage analysis during the compilation in the VisualDSP® configuration:
- Click Project > Project Options.
- In Compile > General, add
--cs-oninto the Additional options field.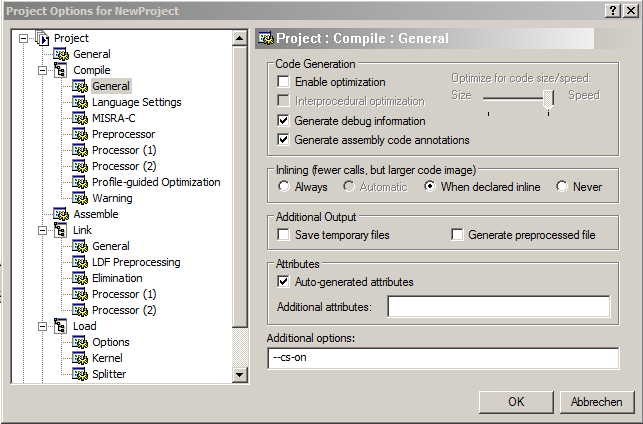
- In Link > General, add
--cs-oninto the Additional options field.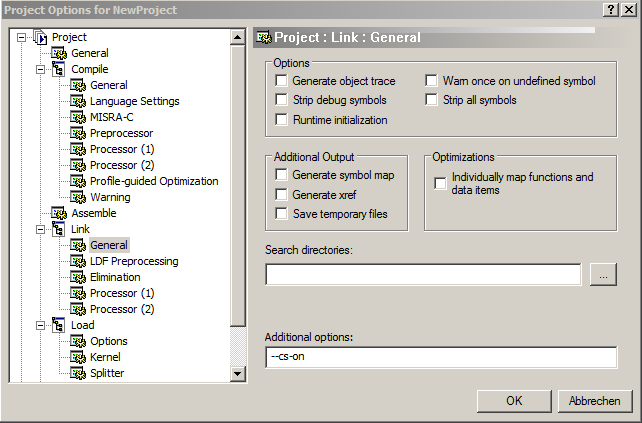
- Rebuild your project.
On most embedded targets, it is necessary to provide a dedicated I/O since no file systems are available for storing the code coverage information. Also, since embedded applications generally never exit, it is often necessary to implement an event handler which saves the execution report upon the reception of a specific trigger.
The simulator emulates the support of a file system. To save the coverage report on the current build directory, it is only necessary to register in the first lines of the main() a custom file I/O which uses the standard C file API.
For example:
#ifdef __COVERAGESCANNER__
static int csfputs(const char *s, void *stream) { return fputs(s, (FILE *)stream); }
static void *csfopenappend(const char *path)    { return (void*)fopen(path,"a+");  }
static int csfclose(void *fp)                   { return fclose((FILE*)fp);        }
#endif

int main()
{
#ifdef __COVERAGESCANNER__
    __coveragescanner_set_custom_io( NULL,
            csfputs,
            csfopenappend,
            NULL,
            NULL,
            csfclose,
            NULL);
#endif
....
}
To record a coverage report when a specific trigger occurs, add the following source code lines in its handler:
#ifdef __COVERAGESCANNER__
    __coveragescanner_save();
    __coveragescanner_clear();
#endif
Coco v7.5.1 ©2026 The Qt Company Ltd.
Qt and respective logos are trademarks of The Qt Company Ltd. in Finland and/or other countries worldwide. All other trademarks are property
of their respective owners.
