StocQt
設定可能な100銘柄の株価チャート
StocQtアプリケーションは、NASDAQ-100をベースにした100銘柄のカスタムリストのトレンドチャートを表示します。ユーザーはリストから銘柄を選択することができます。また、このアプリケーションは比較チャートで使用するために5銘柄までお気に入り登録することができます。
このアプリケーションは、Search、StockCheckBox、StockChart、StockView、SettingsViewなどのカスタムタイプを使用します。これらのタイプは株価データを読みやすい形で表示し、ユーザーがトレンドチャートをカスタマイズできるようになっています。例えば、株価のトレンドを週足、月足、四半期足、半年足で表示することができます。
このアプリケーションでは、APIリクエストや銘柄のお気に入り登録などのデータ処理に、C++で実装されたカスタムStockEngineシングルトンを使用しています。オンライン・データを取得するために、カスタム APIHandler クラスを実装しています。
void ApiHandler::stockHistory(const QString &symbol,
                              std::function<void(QList<HistoryData>)> onComplete)
このアプリケーションは、ObjectModel 型を使用して、依存するビジュアルデータモデルにアクセスします。
    id: mainWindow
        ...
    ListView {
        id: root
        ...
        model: ObjectModel {
            Item {
                id: stockContainer
                width: root.width
                height: root.height
                StockView {
                    id: stockView
                    anchors.fill: parent
                    visible: false
                    width: root.width
                    height: root.height
                    stateGroup: stateList
                }

                StockListView {
                    id: listView
                    visible: true
                    anchors.fill: parent
                    width: root.width
                    height: root.height
                    stateGroup: stateList
                }
            }

            FavoriteView {
                id: favoriteView
                width: root.width
                height: root.height
            }

            SettingsView {
                id: infoView
                width: root.width
                height: root.height
            }
        }
    }
StockListModel はカスタムデータモデルで、銘柄 ID、銘柄名、株価、お気に入りなどの基本情報を含む銘柄をリストアップします。このアプリケーションは、ユーザーがリストから別の銘柄を選択したい場合にこのデータモデルを使用します。
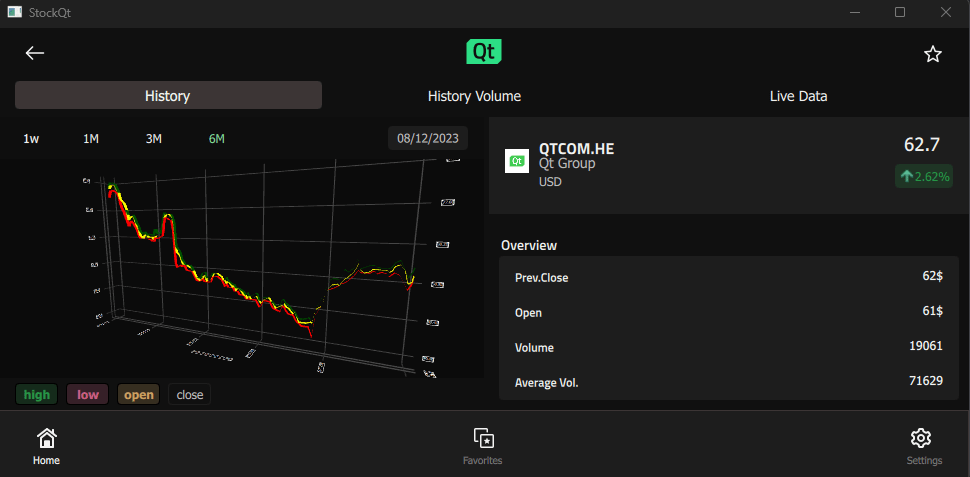
StockViewとFavoriteViewは複雑なデータモデルで、選択された銘柄または最大5銘柄のグループのトレンドチャートを表示します。これらは、別のカスタムタイプであるStockChartまたはFavoriteChartを使用し、 StockEngineからListModelsにデータをロードし、Surface3D 、Bars3D 、またはScatter3D を使用して株価のグラフィカルなトレンドを提示します。
Rectangle {
    id: chart
        ...
    function updateHistory(){
        updateStartDate()
        let startPoint = StockEngine.stockModel.indexOf(startDate)
        let totalPoints = StockEngine.stockModel.historyCount()

        let width = startPoint / 50
        for (let i = 0; i < totalPoints; i++) {
            let epochInDays = StockEngine.stockModel.historyDate(i, false) / 86400
            appendSurfacePoint(openModel, width, epochInDays, StockEngine.stockModel.openPrice(i))
            appendSurfacePoint(closeModel,width, epochInDays, StockEngine.stockModel.closePrice(i))
            appendSurfacePoint(highModel,width, epochInDays, StockEngine.stockModel.highPrice(i))
            appendSurfacePoint(lowModel,width, epochInDays, StockEngine.stockModel.lowPrice(i))
        }
        ...
    Surface3D {
        id: historyGraph
        ...
            Surface3DSeries {
                id: highSeries
                visible: true
                baseColor: "green"
                shading: Surface3DSeries.Shading.Flat
                drawMode: Surface3DSeries.DrawSurface
                itemLabelFormat: "Time: @xLabel High:@yLabel$"
                ItemModelSurfaceDataProxy {
                    itemModel: highModel
                    rowRole: "row"
                    columnRole: "column"
                    yPosRole: "value"
                }
            },
SettingsViewはアプリケーションに関する情報を表示します。
アプリケーションをよりよく理解するには、Qt Creator を使用してコードをブラウズしてください。
例の実行
から例を実行します。 Qt Creatorからサンプルを実行するには、Welcome モードを開き、Examples からサンプルを選択します。詳細については、Qt Creator:Tutorialを参照してください:ビルドと実行。
QMLアプリケーションも参照してください 。
© 2026 The Qt Company Ltd. Documentation contributions included herein are the copyrights of their respective owners. The documentation provided herein is licensed under the terms of the GNU Free Documentation License version 1.3 as published by the Free Software Foundation. Qt and respective logos are trademarks of The Qt Company Ltd. in Finland and/or other countries worldwide. All other trademarks are property of their respective owners.
