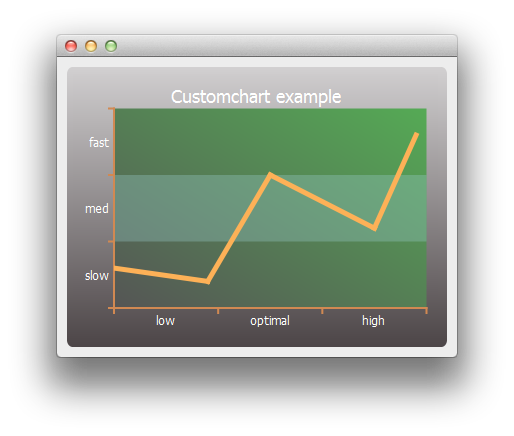
차트 사용자 지정하기
참고: 이 예제는 위젯이 있는 차트 갤러리 예제의 일부입니다.

간단한 선 시리즈와 차트 개체를 만드는 것으로 시작합니다.
auto series = new QLineSeries;
*series << QPointF(0, 6) << QPointF(9, 4) << QPointF(15, 20) << QPointF(25, 12) << QPointF(29, 26);
auto chart = new QChart;
chart->legend()->hide();
chart->addSeries(series);
먼저 시리즈와 차트의 제목 및 배경을 사용자 지정합니다.
// Customize series
QPen pen(QRgb(0xfdb157));
pen.setWidth(5);
series->setPen(pen);

// Customize chart title
QFont font;
font.setPixelSize(18);
chart->setTitleFont(font);
chart->setTitleBrush(QBrush(Qt::white));
chart->setTitle("Custom Chart");

// Customize chart background
QLinearGradient backgroundGradient;
backgroundGradient.setStart(QPointF(0, 0));
backgroundGradient.setFinalStop(QPointF(0, 1));
backgroundGradient.setColorAt(0.0, QRgb(0xd2d0d1));
backgroundGradient.setColorAt(1.0, QRgb(0x4c4547));
backgroundGradient.setCoordinateMode(QGradient::ObjectBoundingMode);
chart->setBackgroundBrush(backgroundGradient);

// Customize plot area background
QLinearGradient plotAreaGradient;
plotAreaGradient.setStart(QPointF(0, 1));
plotAreaGradient.setFinalStop(QPointF(1, 0));
plotAreaGradient.setColorAt(0.0, QRgb(0x555555));
plotAreaGradient.setColorAt(1.0, QRgb(0x55aa55));
plotAreaGradient.setCoordinateMode(QGradient::ObjectBoundingMode);
chart->setPlotAreaBackgroundBrush(plotAreaGradient);
chart->setPlotAreaBackgroundVisible(true);
그런 다음 축을 사용자 지정합니다.
auto axisX = new QCategoryAxis;
auto axisY = new QCategoryAxis;

// Customize axis label font
QFont labelsFont;
labelsFont.setPixelSize(12);
axisX->setLabelsFont(labelsFont);
axisY->setLabelsFont(labelsFont);

// Customize axis colors
QPen axisPen(QRgb(0xd18952));
axisPen.setWidth(2);
axisX->setLinePen(axisPen);
axisY->setLinePen(axisPen);

// Customize axis label colors
QBrush axisBrush(Qt::white);
axisX->setLabelsBrush(axisBrush);
axisY->setLabelsBrush(axisBrush);

// Customize grid lines and shades
axisX->setGridLineVisible(false);
axisY->setGridLineVisible(false);
axisY->setShadesPen(Qt::NoPen);
axisY->setShadesBrush(QBrush(QColor(0x99, 0xcc, 0xcc, 0x55)));
axisY->setShadesVisible(true);
그런 다음 축 레이블 값과 범위를 지정합니다. 축이 준비되면 차트에서 축을 사용하도록 설정합니다.
axisX->append("low", 10);
axisX->append("optimal", 20);
axisX->append("high", 30);
axisX->setRange(0, 30);

axisY->append("slow", 10);
axisY->append("med", 20);
axisY->append("fast", 30);
axisY->setRange(0, 30);

chart->addAxis(axisX, Qt::AlignBottom);
chart->addAxis(axisY, Qt::AlignLeft);
series->attachAxis(axisX);
series->attachAxis(axisY);
마지막으로 차트가 포함된 뷰를 만듭니다.
createDefaultChartView(chart);
이제 차트를 기본 창에 표시할 준비가 되었습니다.
© 2025 The Qt Company Ltd. Documentation contributions included herein are the copyrights of their respective owners. The documentation provided herein is licensed under the terms of the GNU Free Documentation License version 1.3 as published by the Free Software Foundation. Qt and respective logos are trademarks of The Qt Company Ltd. in Finland and/or other countries worldwide. All other trademarks are property of their respective owners.

