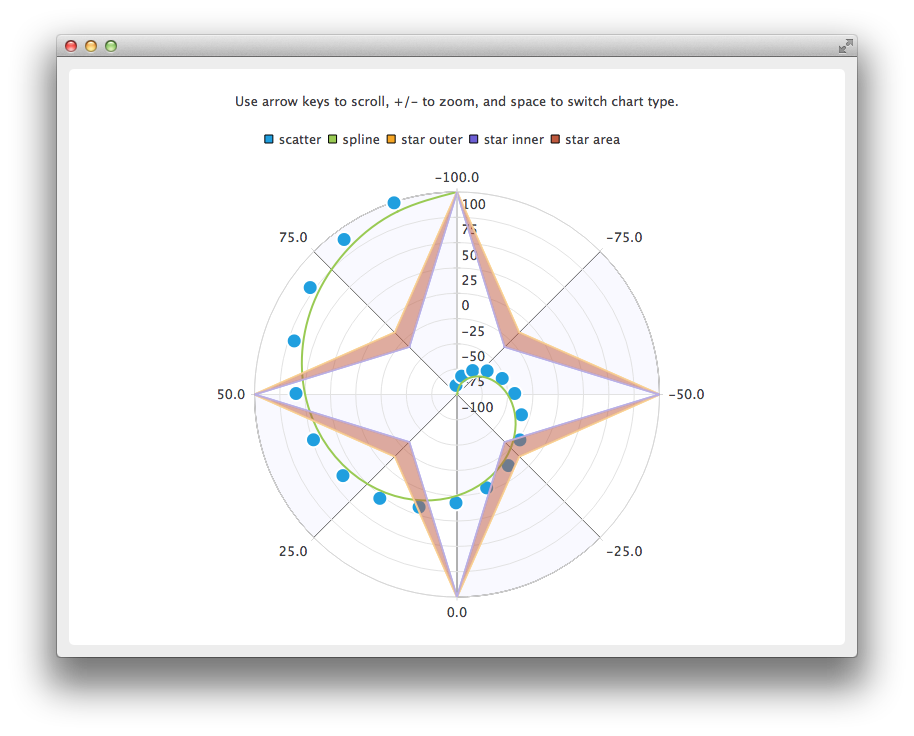
극좌표 차트 만들기
참고: 이 예제는 위젯이 있는 차트 갤러리 예제의 일부입니다.
또한 폴라 차트의 스크롤 및 확대/축소를 구현하는 방법과 폴라 차트와 데카르트 차트가 서로 어떻게 관련되어 있는지 시각적으로 보여 줍니다.

극형 차트는 QChart 인스턴스 대신 QPolarChart 인스턴스를 사용하여 만듭니다.
auto chart = new QPolarChart;
축은 데카르트 차트와 유사하게 생성되지만, 차트에 축을 추가할 때 정렬 대신 극좌표 방향을 사용할 수 있습니다.
auto angularAxis = new QValueAxis;
angularAxis->setTickCount(9); // First and last ticks are co-located on 0/360 angle.
angularAxis->setLabelFormat("%.1f");
angularAxis->setShadesVisible(true);
angularAxis->setShadesBrush(QBrush(QColor(249, 249, 255)));
chart->addAxis(angularAxis, QPolarChart::PolarOrientationAngular);

auto radialAxis = new QValueAxis;
radialAxis->setTickCount(9);
radialAxis->setLabelFormat("%d");
chart->addAxis(radialAxis, QPolarChart::PolarOrientationRadial);
극좌표 차트의 확대/축소 및 스크롤은 직교 차트의 확대/축소 및 스크롤과 논리적으로 거의 동일합니다. 가장 큰 차이점은 X축(각도 축)을 따라 스크롤할 때 픽셀 수 대신 각도를 사용한다는 것입니다. 또 다른 차이점은 직사각형으로 확대/축소할 수 없다는 것입니다.
void PolarChartView::keyPressEvent(QKeyEvent *event)
{
    switch (event->key()) {
    case Qt::Key_Plus:
        chart()->zoomIn();
        break;
    case Qt::Key_Minus:
        chart()->zoomOut();
        break;
    case Qt::Key_Left:
        chart()->scroll(-1.0, 0);
        break;
    case Qt::Key_Right:
        chart()->scroll(1.0, 0);
        break;
    case Qt::Key_Up:
        chart()->scroll(0, 1.0);
        break;
    case Qt::Key_Down:
        chart()->scroll(0, -1.0);
        break;
    case Qt::Key_Space:
        switchChartType();
        break;
    default:
        QGraphicsView::keyPressEvent(event);
        break;
    }
}
직교 차트와 극좌표 차트 모두에서 동일한 축과 계열을 사용할 수 있지만 동시에 사용할 수는 없습니다. 차트 유형 간에 전환하려면 먼저 이전 차트에서 계열과 축을 제거한 다음 새 차트에 추가해야 합니다. 축 범위를 유지하려면 축 범위도 복사해야 합니다.
void PolarChartView::switchChartType()
{
    QChart *newChart;
    QChart *oldChart = chart();

    if (oldChart->chartType() == QChart::ChartTypeCartesian)
        newChart = new QPolarChart;
    else
        newChart = new QChart;

    // Move series and axes from old chart to new one
    const QList<QAbstractSeries *> seriesList = oldChart->series();
    const QList<QAbstractAxis *> axisList = oldChart->axes();
    QList<QPair<qreal, qreal> > axisRanges;

    for (QAbstractAxis *axis : axisList) {
        auto valueAxis = static_cast<QValueAxis *>(axis);
        axisRanges.append(QPair<qreal, qreal>(valueAxis->min(), valueAxis->max()));
    }

    for (QAbstractSeries *series : seriesList)
        oldChart->removeSeries(series);

    for (QAbstractAxis *axis : axisList) {
        oldChart->removeAxis(axis);
        newChart->addAxis(axis, axis->alignment());
    }

    for (QAbstractSeries *series : seriesList) {
        newChart->addSeries(series);
        for (QAbstractAxis *axis : axisList)
            series->attachAxis(axis);
    }

    int count = 0;
    for (QAbstractAxis *axis : axisList) {
        axis->setRange(axisRanges[count].first, axisRanges[count].second);
        count++;
    }

    newChart->setTitle(oldChart->title());
    setChart(newChart);
    delete oldChart;
}
© 2025 The Qt Company Ltd. Documentation contributions included herein are the copyrights of their respective owners. The documentation provided herein is licensed under the terms of the GNU Free Documentation License version 1.3 as published by the Free Software Foundation. Qt and respective logos are trademarks of The Qt Company Ltd. in Finland and/or other countries worldwide. All other trademarks are property of their respective owners.

