QPolarChart Class
QPolarChart는 데이터를 극좌표 차트로 표시합니다. 더 보기...
| Header: | #include <QPolarChart> |
| Inherits: | QChart |
공용 유형
| enum | PolarOrientation { PolarOrientationRadial, PolarOrientationAngular } |
| flags | PolarOrientations |
공용 함수
| QPolarChart(QGraphicsItem *parent = nullptr, Qt::WindowFlags wFlags = Qt::WindowFlags()) | |
| virtual | ~QPolarChart() |
| void | addAxis(QAbstractAxis *axis, QPolarChart::PolarOrientation polarOrientation) |
| QList<QAbstractAxis *> | axes(QPolarChart::PolarOrientations polarOrientation = PolarOrientations(PolarOrientationRadial | PolarOrientationAngular), QAbstractSeries *series = nullptr) const |
정적 공용 멤버
| QPolarChart::PolarOrientation | axisPolarOrientation(QAbstractAxis *axis) |
자세한 설명
극형 차트는 원형 그래프로 데이터를 표시하며, 데이터의 배치는 그래프의 중심인 극으로부터의 각도와 거리에 따라 결정됩니다.
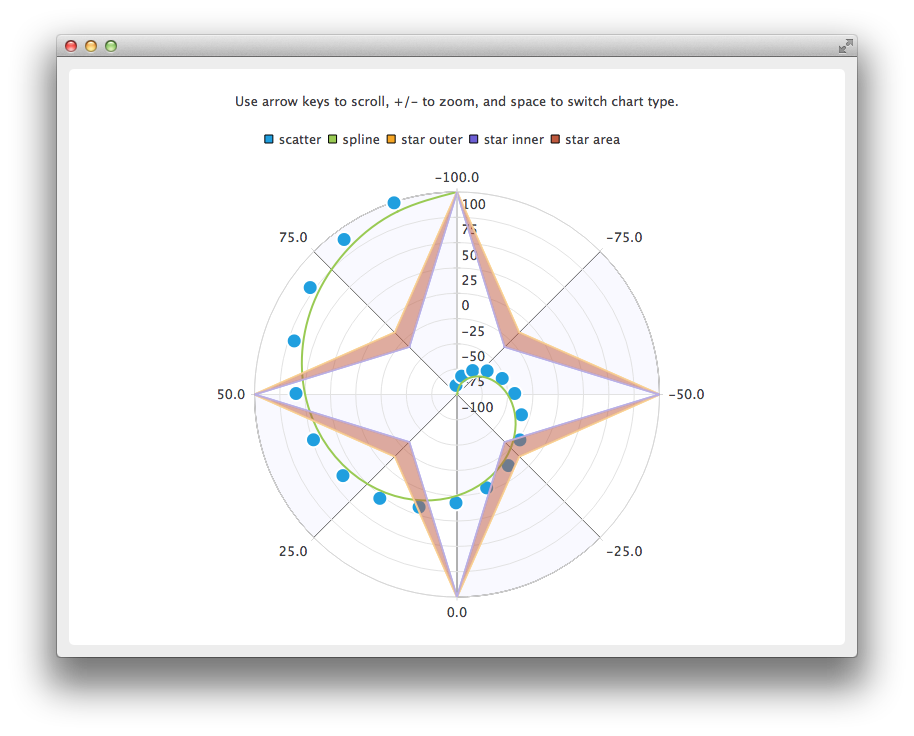
극형 차트는 선형, 스플라인, 면적, 분산형 계열 및 해당 계열에서 지원하는 모든 축 유형을 지원하는 QChart 의 특수화입니다. 각 축은 방사형 축 또는 각도 축으로 사용할 수 있습니다.
각축( QValueAxis )의 첫 번째와 마지막 눈금표는 0/360도 각도로 함께 위치합니다.
연속된 두 점 사이의 각도 거리가 180도를 초과하는 경우 두 점을 연결하는 직선은 의미가 없어지고 그려지지 않습니다. 대신 차트의 중심을 오가는 선이 그려집니다. 따라서 선, 스플라인 또는 영역 계열을 표시할 때는 축 범위를 적절히 선택해야 합니다.
극좌표형 차트는 같은 방향의 모든 축을 같은 위치에 그리므로 추가 축을 그리드를 사용자 지정하는 데만 사용하지 않는 한 같은 방향의 여러 축을 사용하면 혼란스러울 수 있습니다. 예를 들어, 강조 표시된 범위를 음영 처리된 보조 음영 QCategoryAxis 으로 표시하거나 레이블이 없는 하위 틱에 레이블이 숨겨진 보조 QValueAxis 을 제공할 수 있습니다.
QChart도 참조하세요 .
멤버 유형 문서
열거형 QPolarChart::PolarOrientation
플래그 QPolarChart::PolarOrientations
이 열거형 타입은 축의 극좌표를 지정합니다.
| Constant | 값 | 설명 |
|---|---|---|
QPolarChart::PolarOrientationRadial | 0x1 | 극점에서 시작하여 차트의 반지름을 따라 값이 배치되는 방사형 축입니다. |
QPolarChart::PolarOrientationAngular | 0x2 | 각도 축 - 차트를 중심으로 값이 배치되는 각도 축입니다. |
PolarOrientations 유형은 QFlags<PolarOrientation>에 대한 타입 정의입니다. PolarOrientation 값의 OR 조합을 저장합니다.
멤버 함수 문서
[explicit] QPolarChart::QPolarChart(QGraphicsItem *parent = nullptr, Qt::WindowFlags wFlags = Qt::WindowFlags())
parent 의 자식으로 폴라 차트를 생성합니다. wFlags 에서 지정한 속성은 QChart 생성자에게 전달됩니다.
[virtual noexcept] QPolarChart::~QPolarChart()
극좌표형 차트 개체와 여기에 추가된 계열 및 축 개체와 같은 하위 개체를 삭제합니다.
void QPolarChart::addAxis(QAbstractAxis *axis, QPolarChart::PolarOrientation polarOrientation)
이 편리한 방법은 극좌표 방향이 polarOrientation 인 극좌표 차트에 축 axis 을 추가합니다. 차트는 축의 소유권을 갖습니다.
참고: QChart::addAxis()를 사용하여 극좌표 차트에 축을 추가할 수도 있습니다. 지정된 정렬에 따라 극 방향이 결정됩니다. 가로 정렬은 각도 축을 나타내고 세로 정렬은 방사형 축을 나타냅니다.
QChart::removeAxis(), QChart::createDefaultAxes(), QAbstractSeries::attachAxis() 및 QChart::addAxis()도 참조하세요 .
QList<QAbstractAxis *> QPolarChart::axes(QPolarChart::PolarOrientations polarOrientation = PolarOrientations(PolarOrientationRadial | PolarOrientationAngular), QAbstractSeries *series = nullptr) const
극좌표 방향이 polarOrientation 인 계열 series 에 추가된 축을 반환합니다. 계열이 제공되지 않으면 지정된 극좌표 방향의 축이 반환됩니다.
addAxis()도 참조하세요 .
[static] QPolarChart::PolarOrientation QPolarChart::axisPolarOrientation(QAbstractAxis *axis)
극좌표 차트의 각도 축은 가로 방향을, 방사형 축은 세로 방향을 나타냅니다. 이 함수는 axis 축의 방향을 해당 극좌표 방향으로 변환하기 위한 편의 함수입니다. axis 이 null이거나 극좌표형 차트에 추가되지 않은 경우 반환 값은 의미가 없습니다.
© 2026 The Qt Company Ltd. Documentation contributions included herein are the copyrights of their respective owners. The documentation provided herein is licensed under the terms of the GNU Free Documentation License version 1.3 as published by the Free Software Foundation. Qt and respective logos are trademarks of The Qt Company Ltd. in Finland and/or other countries worldwide. All other trademarks are property of their respective owners.
