축 처리
QML에서 사용자 지정 입력 핸들러로 축 드래그를 구현하고 사용자 지정 축 포맷터를 생성합니다.
축처리에서는 축을 사용하는 두 가지 사용자 지정 기능을 보여줍니다. 이 기능들은 애플리케이션에 자체 탭이 있습니다.
다음 섹션에서는 이러한 기능에만 집중하고 기본 기능에 대한 설명은 생략합니다. 자세한 QML 예제 설명서는 간단한 분산형 그래프를 참조하십시오.
예제 실행하기
에서 예제를 실행하려면 Qt Creator에서 Welcome 모드를 열고 Examples 에서 예제를 선택합니다. 자세한 내용은 Qt Creator: 튜토리얼을 참조하세요 : 빌드 및 실행을 참조하십시오.
축 드래그
Axis Dragging 탭에서 축 레이블을 드래그하여 축 범위를 변경할 수 있는 사용자 지정 입력 핸들러를 QML에 구현합니다. 또한 직교 투영을 사용하고 사용자 지정 항목의 속성을 동적으로 업데이트합니다.
기본 입력 처리 재정의
기본 입력 처리 메커니즘을 비활성화하려면 Scatter3D 의 기본 입력 처리기를 설정 해제합니다:
unsetDefaultInputHandler();
    ...
그런 다음 MouseArea 을 추가하고 scatterGraph 이 포함된 것과 동일한 Item 을 부모로 채우도록 설정합니다. 또한 이 예제에서는 다른 버튼은 필요하지 않으므로 마우스 왼쪽 버튼 누르기만 허용하도록 설정합니다:
MouseArea {
    anchors.fill: parent
    hoverEnabled: true
    acceptedButtons: Qt.LeftButton
    ...
그런 다음 마우스 누름을 수신하고 포착되면 선택 쿼리를 그래프로 전송합니다:
onPressed: (mouse)=> {
               scatterGraph.doPicking(Qt.point(mouse.x, mouse.y));
           }
onPositionChanged 신호 핸들러는 이동 거리 계산에 필요한 현재 마우스 위치를 포착합니다:
onPositionChanged: (mouse)=> {
                       currentMouseX = mouse.x;
                       currentMouseY = mouse.y;
    ...
onPositionChanged 의 끝에 나중에 소개할 이동 거리 계산을 위해 이전 마우스 위치를 저장합니다:
...
    previousMouseX = currentMouseX;
    previousMouseY = currentMouseY;
}
마우스 움직임을 축 범위 변경으로 변환하기
scatterGraph 에서 onSelectedElementChanged 신호는 inputArea 의 onPressed 에서 선택 쿼리가 수행된 후 방출됩니다. 요소 유형을 관심 있는 유형이므로 메인 컴포넌트에서 정의한 속성(property int selectedAxisLabel: -1)으로 설정합니다:
onSelectedElementChanged: {
    if (selectedElement >= Graphs3D.ElementType.AxisXLabel
            && selectedElement <= Graphs3D.ElementType.AxisZLabel) {
        selectedAxisLabel = selectedElement;
    } else {
        selectedAxisLabel = -1;
    }
}
그런 다음 inputArea 의 onPositionChanged 로 돌아와 마우스 버튼이 눌렸는지, 현재 축 레이블이 선택되어 있는지 확인합니다. 조건이 충족되면 마우스 이동을 축 범위 업데이트로 변환하는 함수를 호출합니다:
...
if (pressed && selectedAxisLabel != -1)
    axisDragView.dragAxis();
...
이 경우 카메라 회전이 고정되어 있으므로 변환이 쉽습니다. 미리 계산된 값을 사용하고 마우스 이동 거리를 계산한 다음 선택한 축 범위에 값을 적용할 수 있습니다:
function dragAxis() {
    // Do nothing if previous mouse position is uninitialized
    if (previousMouseX === -1)
        return;

    // Directional drag multipliers based on rotation. Camera is locked to 45 degrees, so we
    // can use one precalculated value instead of calculating xx, xy, zx and zy individually
    var cameraMultiplier = 0.70710678;

    // Calculate the mouse move amount
    var moveX = currentMouseX - previousMouseX;
    var moveY = currentMouseY - previousMouseY;

    // Adjust axes
    switch (selectedAxisLabel) {
    case Graphs3D.ElementType.AxisXLabel:
        var distance = ((moveX - moveY) * cameraMultiplier) / dragSpeedModifier;
        // Check if we need to change min or max first to avoid invalid ranges
        if (distance > 0) {
            scatterGraph.axisX.min -= distance;
            scatterGraph.axisX.max -= distance;
        } else {
            scatterGraph.axisX.max -= distance;
            scatterGraph.axisX.min -= distance;
        }
        break;
    case Graphs3D.ElementType.AxisYLabel:
        distance = moveY / dragSpeedModifier;
        // Check if we need to change min or max first to avoid invalid ranges
        if (distance > 0) {
            scatterGraph.axisY.max += distance;
            scatterGraph.axisY.min += distance;
        } else {
            scatterGraph.axisY.min += distance;
            scatterGraph.axisY.max += distance;
        }
        break;
    case Graphs3D.ElementType.AxisZLabel:
        distance = ((moveX + moveY) * cameraMultiplier) / dragSpeedModifier;
        // Check if we need to change min or max first to avoid invalid ranges
        if (distance > 0) {
            scatterGraph.axisZ.max += distance;
            scatterGraph.axisZ.min += distance;
        } else {
            scatterGraph.axisZ.min += distance;
            scatterGraph.axisZ.max += distance;
        }
        break;
    }
}
마우스 이동에서 축 범위 업데이트로의 보다 정교한 변환에 대해서는 그래프 갤러리를 참조하세요.
기타 기능
이 예시에서는 직교 투영을 사용하는 방법과 사용자 지정 항목의 속성을 즉시 업데이트하는 방법도 보여줍니다.
직교 투영은 매우 간단합니다. scatterGraph 의 orthoProjection 속성을 변경하기만 하면 됩니다. 이 예제에는 이를 켜고 끌 수 있는 버튼이 있습니다:
Button {
    id: orthoToggle
    width: axisDragView.portraitMode ? parent.width : parent.width / 3
    text: "Display Orthographic"
    anchors.left: axisDragView.portraitMode ? parent.left : rangeToggle.right
    anchors.top: axisDragView.portraitMode ? rangeToggle.bottom : parent.top
    onClicked: {
        if (scatterGraph.orthoProjection) {
            text = "Display Orthographic";
            scatterGraph.orthoProjection = false;
            // Orthographic projection disables shadows, so we need to switch them back on
            scatterGraph.shadowQuality = Graphs3D.ShadowQuality.Medium
        } else {
            text = "Display Perspective";
            scatterGraph.orthoProjection = true;
        }
    }
}
사용자 지정 항목의 경우 scatterGraph 의 customItemList 에 하나를 추가합니다:
customItemList: [
    Custom3DItem {
        id: qtCube
        meshFile: ":/qml/axishandling/cube.mesh"
        textureFile: ":/qml/axishandling/cubetexture.png"
        position: Qt.vector3d(0.65, 0.35, 0.65)
        scaling: Qt.vector3d(0.3, 0.3, 0.3)
    }
]
그래프의 모든 항목을 추가, 제거 및 회전하는 타이머를 구현하고 사용자 지정 항목을 회전하는 데 동일한 타이머를 사용합니다:
onTriggered: {
    rotationAngle = rotationAngle + 1;
    qtCube.setRotationAxisAndAngle(Qt.vector3d(1, 0, 1), rotationAngle);
    ...
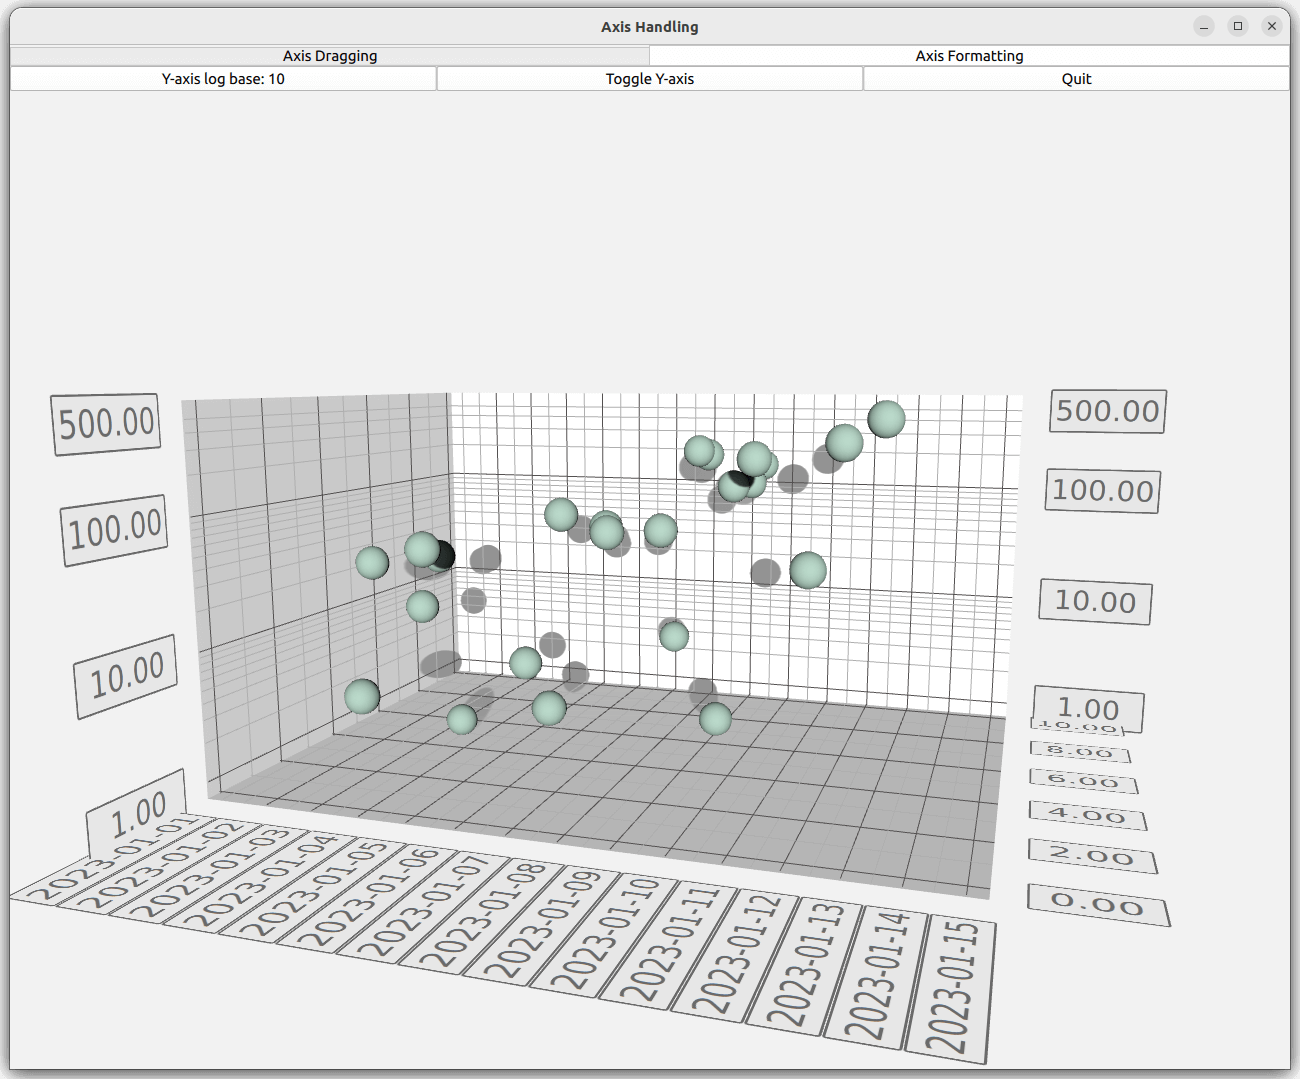
축 포맷터
Axis Formatter 탭에서 사용자 지정 축 포맷터를 만듭니다. 미리 정의된 축 포맷터를 사용하는 방법도 설명합니다.
사용자 지정 축 포맷터
축 포맷터를 사용자 지정하려면 QValue3DAxisFormatter 을 서브클래싱해야 하는데, 이는 QML 코드만으로는 할 수 없습니다. 이 예제에서 축은 실수 값을 타임스탬프로 해석하고 축 레이블에 날짜를 표시합니다. 이를 위해 QValue3DAxisFormatter 을 서브클래스하는 CustomFormatter 이라는 새 클래스를 도입합니다:
class CustomFormatter : public QValue3DAxisFormatter
{
...
QScatter3DSeries 의 실수 값은 데이터 폭의 차이로 인해 QDateTime 값으로 직접 형변환할 수 없으므로 둘 사이에 일종의 매핑이 필요합니다. 매핑을 수행하려면 포맷터의 원본 날짜를 지정하고 QScatter3DSeries 의 부동 소수점 값을 해당 원본 값에 대한 날짜 오프셋으로 해석합니다. 원본 날짜는 속성으로 제공됩니다:
Q_PROPERTY(QDate originDate READ originDate WRITE setOriginDate NOTIFY originDateChanged)값에서 QDateTime 로 매핑하려면 valueToDateTime() 메서드를 사용합니다:
QDateTime CustomFormatter::valueToDateTime(qreal value) const
{
    return m_originDate.startOfDay().addMSecs(qint64(oneDayMs * value));
}
축 포맷터로 작동하려면 CustomFormatter 에서 몇 가지 가상 메서드를 다시 구현해야 합니다:
QValue3DAxisFormatter *createNewInstance() const override; void populateCopy(QValue3DAxisFormatter ©) override; void recalculate() override; QString stringForValue(qreal value, const QString &format) override;
CustomFormatter 의 새 인스턴스를 만들고 필요한 데이터를 복사하기만 하면 됩니다. 이 두 가지 메서드를 사용하여 렌더링 목적으로 포맷터 캐시를 생성하고 업데이트합니다. populateCopy() 의 수퍼클래스 구현을 호출하는 것을 잊지 마세요:
QValue3DAxisFormatter *CustomFormatter::createNewInstance() const { return new CustomFormatter(); } void CustomFormatter::populateCopy(QValue3DAxisFormatter ©) { QValue3DAxisFormatter::populateCopy(copy); CustomFormatter *customFormatter = static_cast<CustomFormatter *>(©); customFormatter->m_originDate = m_originDate; customFormatter->m_selectionFormat = m_selectionFormat; }
CustomFormatter 의 슈퍼클래스 구현은 recalculate() 메서드에서 대부분의 작업을 수행하며, 여기서 포맷터는 그리드, 서브그리드 및 레이블 위치를 계산하고 레이블 문자열의 형식을 지정합니다. 사용자 지정 서식 지정자에서는 축의 세그먼트 수를 무시하고 항상 자정에 그리드 선을 그립니다. 하위 세그먼트 수와 레이블 위치는 정상적으로 처리됩니다:
void CustomFormatter::recalculate()
{
    // We want our axis to always have gridlines at date breaks

    // Convert range into QDateTimes
    QDateTime minTime = valueToDateTime(qreal(axis()->min()));
    QDateTime maxTime = valueToDateTime(qreal(axis()->max()));

    // Find out the grid counts
    QTime midnight(0, 0);
    QDateTime minFullDate(minTime.date(), midnight);
    int gridCount = 0;
    if (minFullDate != minTime)
        minFullDate = minFullDate.addDays(1);
    QDateTime maxFullDate(maxTime.date(), midnight);

    gridCount += minFullDate.daysTo(maxFullDate) + 1;
    int subGridCount = axis()->subSegmentCount() - 1;

    QList<float> gridPositions;
    QList<float> subGridPositions;
    QList<float> labelPositions;
    QStringList labelStrings;

    // Reserve space for position arrays and label strings
    gridPositions.resize(gridCount);
    subGridPositions.resize((gridCount + 1) * subGridCount);
    labelPositions.resize(gridCount);
    labelStrings.reserve(gridCount);

    // Calculate positions and format labels
    qint64 startMs = minTime.toMSecsSinceEpoch();
    qint64 endMs = maxTime.toMSecsSinceEpoch();
    qreal dateNormalizer = endMs - startMs;
    qreal firstLineOffset = (minFullDate.toMSecsSinceEpoch() - startMs) / dateNormalizer;
    qreal segmentStep = oneDayMs / dateNormalizer;
    qreal subSegmentStep = 0;
    if (subGridCount > 0)
        subSegmentStep = segmentStep / qreal(subGridCount + 1);

    for (int i = 0; i < gridCount; i++) {
        qreal gridValue = firstLineOffset + (segmentStep * qreal(i));
        gridPositions[i] = float(gridValue);
        labelPositions[i] = float(gridValue);
        labelStrings << minFullDate.addDays(i).toString(axis()->labelFormat());
    }

    for (int i = 0; i <= gridCount; i++) {
        if (subGridPositions.size()) {
            for (int j = 0; j < subGridCount; j++) {
                float position;
                if (i)
                    position = gridPositions.at(i - 1) + subSegmentStep * (j + 1);
                else
                    position = gridPositions.at(0) - segmentStep + subSegmentStep * (j + 1);
                if (position > 1.0f || position < 0.0f)
                    position = gridPositions.at(0);
                subGridPositions[i * subGridCount + j] = position;
            }
        }
    }
    setGridPoitions(gridPositions);
    setSubGridPositions(subGridPositions);
    setlabelPositions(labelPositions);
    setLabelStrings(labelStrings);
}
축 레이블은 날짜만 표시하도록 서식이 지정됩니다. 그러나 선택 레이블의 타임스탬프 해상도를 높이려면 사용자 지정 포맷터에 다른 속성을 지정하여 사용자가 사용자 지정할 수 있도록 합니다:
Q_PROPERTY(QString selectionFormat READ selectionFormat WRITE setSelectionFormat NOTIFY
               selectionFormatChanged)
이 선택 서식 속성은 다시 구현된 stringToValue 메서드에서 사용되며, 여기서 제출된 서식은 무시되고 사용자 지정 선택 서식으로 대체됩니다:
QString CustomFormatter::stringForValue(qreal value, const QString &format)
{
    Q_UNUSED(format);

    return valueToDateTime(value).toString(m_selectionFormat);
}
새 사용자 지정 포맷터를 QML에 노출하려면 이를 선언하고 QML 모듈로 만드세요. 이 방법에 대한 자세한 내용은 표면 그래프 갤러리를 참조하세요.
QML
QML 코드에서 각 차원에 대해 다른 축을 정의합니다:
axisZ: valueAxis
axisY: logAxis
axisX: dateAxis
Z축은 일반 Value3DAxis 입니다:
Value3DAxis {
    id: valueAxis
    segmentCount: 5
    subSegmentCount: 2
    labelFormat: "%.2f"
    min: 0
    max: 10
}
Y축의 경우 로그 축을 정의합니다. Value3DAxis 에 로그 눈금을 표시하려면 축의 formatter 속성에 LogValue3DAxisFormatter 을 지정합니다:
Value3DAxis {
    id: logAxis
    formatter: LogValue3DAxisFormatter {
        id: logAxisFormatter
        base: 10
        autoSubGrid: true
        edgeLabelsVisible: true
    }
    labelFormat: "%.2f"
}
마지막으로 X 축에는 새로운 CustomFormatter 을 사용합니다:
Value3DAxis {
    id: dateAxis
    formatter: CustomFormatter {
        originDate: "2023-01-01"
        selectionFormat: "yyyy-MM-dd HH:mm:ss"
    }
    subSegmentCount: 2
    labelFormat: "yyyy-MM-dd"
    min: 0
    max: 14
}
나머지 애플리케이션은 축을 수정하고 그래프를 표시하는 매우 자명한 로직으로 구성되어 있습니다.
예제 콘텐츠
© 2026 The Qt Company Ltd. Documentation contributions included herein are the copyrights of their respective owners. The documentation provided herein is licensed under the terms of the GNU Free Documentation License version 1.3 as published by the Free Software Foundation. Qt and respective logos are trademarks of The Qt Company Ltd. in Finland and/or other countries worldwide. All other trademarks are property of their respective owners.
