
MapItemView 전환 효과 (QML)
MapItemView 와 함께 전환 효과를 사용하는 방법.
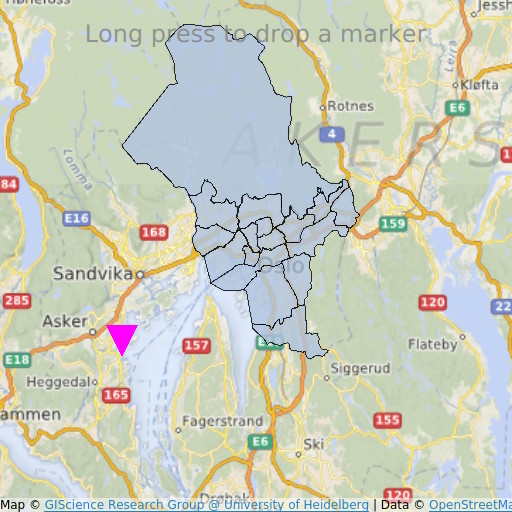
MapItemView 'Transitions' 예제는 Map 항목을 사용하여 지도를 렌더링하는 방법을 보여줍니다. 이 예제는 지도를 표시하는 데 필요한 최소한의 코드를 보여주며, 향후 실험을 위한 기초 자료로 활용할 수 있습니다.
예제 실행
다음 경로에서 예제를 실행할 수 있습니다:
- Qt Creator
Welcome 모드를 열고 Examples 에서 예제를 선택하십시오. 자세한 내용은 Qt Creator: 튜토리얼: 빌드 및 실행을 참조하십시오.
- Qt Extension for Visual Studio Code
Command Palette 에서 Qt: Open Qt examples 명령을 실행하고 목록에서 예제를 선택합니다. 자세한 내용은 Qt Extension for Visual Studio Code: 튜토리얼: 빌드 및 실행을 참조하십시오.
QML 코드
main.qml 에서는 두 개의 MapItemView 요소가 사용되며, 이를 통해 오슬로 지역의 행정 구역을 지도에 추가하고, 길게 누를 때 마커를 추가합니다.
MapItemView {
    id: mivMarker

    add: Transition {
        NumberAnimation {
            property: "slideIn"
            from: 50
            to: 0
            duration: 500
            easing.type: Easing.OutBounce
            easing.amplitude: 3.0
        }
    }

    remove: Transition {
        NumberAnimation {
            property: "opacity"
            to: 0.1
            duration: 50
        }
    }

    model: ListModel {
        id: markerModel
    }
    delegate: Component {
        MapQuickItem {
            coordinate: QtPositioning.coordinate(latitude, longitude)
            anchorPoint: Qt.point(e1.width * 0.5, e1.height + slideIn)
            property real slideIn : 0
            sourceItem: Shape {
                id: e1
                vendorExtensionsEnabled: false
                width: 32
                height: 32
                visible: true

                transform: Scale {
                    origin.y: e1.height * 0.5
                    yScale: -1
                }

                ShapePath {
                    id: c_sp1
                    strokeWidth: -1
                    fillColor: Qt.rgba(1,0,1,1.0)

                    property real half: e1.width * 0.5
                    property real quarter: e1.width * 0.25
                    property point center: Qt.point(e1.x + e1.width * 0.5 , e1.y + e1.height * 0.5)

                    property point top: Qt.point(center.x, center.y - half )
                    property point bottomLeft: Qt.point(center.x - half, center.y + half )
                    property point bottomRight: Qt.point(center.x + half, center.y + half )

                    startX: center.x;
                    startY: center.y + half

                    PathLine { x: c_sp1.bottomLeft.x; y: c_sp1.bottomLeft.y }
                    PathLine { x: c_sp1.top.x; y: c_sp1.top.y }
                    PathLine { x: c_sp1.bottomRight.x; y: c_sp1.bottomRight.y }
                    PathLine { x: c_sp1.center.x; y: c_sp1.center.y + c_sp1.half }
                }
            }
        }
    }
}
마커 뷰는 마커가 튀어 오르는 효과를 만들기 위해 추가 및 제거 전환을 모두 지정합니다.
MapItemView {
    id: miv
    model: OsloListModel {
        id: osloListModel
    }
    add: Transition {
        NumberAnimation {
            property: "animationScale"
            from: 0.2
            to: 1
            duration: 800
            easing.type: Easing.OutCubic
        }
    }
    delegate: Component {
        MapPolygon {
            function fromMercator(l, centroid) {
                var res = []
                for (var i  = 0; i < l.length; i++) {
                    var vtx = l[i]
                    var offset = Qt.point((vtx.x - centroid.x) * animationScale,
                                          (vtx.y - centroid.y) * animationScale)
                    var pt = Qt.point(centroid.x + offset.x, centroid.y + offset.y)
                    res.push( QtPositioning.mercatorToCoord(pt) )
                }
                return res;
            }

            path: fromMercator(osloListModel.geometries[name+"_"+adminLevel]
                               , osloListModel.centroids[name+"_"+adminLevel] )
            color: ((adminLevel > 4) ? "lightsteelblue" : 'firebrick')
            property real animationScale : 1
            opacity: ((adminLevel < 9) ? 0.1 : 0.8)
            visible: true
        }
    }
}
행정 구역 뷰는 구역이 커지는 효과를 만들기 위해 추가 전환만 지정합니다.
필수 조건
이 예제를 실행하려면 OpenStreetMap 의 지도 타일을 다운로드할 수 있도록 인터넷이 연결되어 있어야 합니다. 선택 사항인 시스템 프록시는 자동으로 감지되어야 합니다.
© 2026 The Qt Company Ltd. Documentation contributions included herein are the copyrights of their respective owners. The documentation provided herein is licensed under the terms of the GNU Free Documentation License version 1.3 as published by the Free Software Foundation. Qt and respective logos are trademarks of The Qt Company Ltd. in Finland and/or other countries worldwide. All other trademarks are property of their respective owners.
