AreaSeries QML Type
以区域图显示数据。更多
| Import Statement: | import QtCharts 2.11 |
| In C++: | QAreaSeries |
| Inherits: |
属性
- axisAngular : AbstractAxis
- axisRadial : AbstractAxis
- axisX : AbstractAxis
- axisXTop : AbstractAxis
- axisY : AbstractAxis
- axisYRight : AbstractAxis
- borderColor : color
- borderWidth : real
- brush : brush
- brushFilename : string
- color : color
- lowerSeries : LineSeries
- pointLabelsClipping : bool
- pointLabelsColor : font
- pointLabelsFont : font
- pointLabelsFormat : string
- pointLabelsVisible : bool
- upperSeries : LineSeries
信号
- clicked(point point)
- doubleClicked(point point)
- hovered(point point, bool state)
- pressed(point point)
- released(point point)
详细说明
面积序列用于显示定量数据。它以线性序列为基础,边界线之间的区域用颜色强调。LineSeries 类型定义了区域的上边界。默认情况下,区域图是以绘图区域的底部作为下边界绘制的。下边界可以用另一条线代替绘图区域的底部。在这种情况下,AreaSeries 应使用两个LineSeries 类型。
注意: 在下边界值大于上边界值的情况下,上边界和下边界可能会引起误解。要点是这两条边界线之间的区域将被填满。
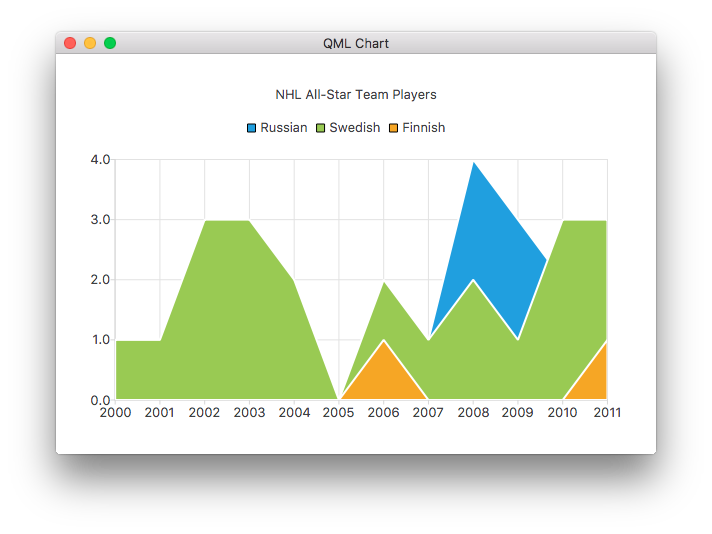
下面的 QML 演示了如何创建一个简单的区域图:
ChartView {
    title: "NHL All-Star Team Players"
    anchors.fill: parent
    antialiasing: true

    // Define x-axis to be used with the series instead of default one
    ValueAxis {
        id: valueAxis
        min: 2000
        max: 2011
        tickCount: 12
        labelFormat: "%.0f"
    }

    AreaSeries {
        name: "Russian"
        axisX: valueAxis
        upperSeries: LineSeries {
            XYPoint { x: 2000; y: 1 }
            XYPoint { x: 2001; y: 1 }
            XYPoint { x: 2002; y: 1 }
            XYPoint { x: 2003; y: 1 }
            XYPoint { x: 2004; y: 1 }
            XYPoint { x: 2005; y: 0 }
            XYPoint { x: 2006; y: 1 }
            XYPoint { x: 2007; y: 1 }
            XYPoint { x: 2008; y: 4 }
            XYPoint { x: 2009; y: 3 }
            XYPoint { x: 2010; y: 2 }
            XYPoint { x: 2011; y: 1 }
        }
    }
注意: 不支持在图表和区域系列中添加相同的线系列。用作边界线的系列应仅为区域系列定义。
属性文档
axisAngular : AbstractAxis
极坐标图视图周围绘制的用于系列的角轴。
另请参阅 axisX 和PolarChartView 。
axisRadial : AbstractAxis
极坐标图视图内绘制的用于系列的径向轴。
另请参阅 axisY 和PolarChartView 。
axisX : AbstractAxis
用于系列的 X 轴。如果不定义 axisX 和axisXTop ,则会为序列创建一个值轴。
axisXTop : AbstractAxis
用于系列的 x 轴,绘制在图表视图的顶部。
注意: 只能提供axisX 或 axisXTop,不能同时提供。
另请参阅 axisX 。
axisY : AbstractAxis
用于序列的 Y 轴。如果不定义 axisY 和axisYRight ,则会为序列创建一个值轴。
另请参阅 axisYRight 和ValueAxis 。
axisYRight : AbstractAxis
用于系列的 Y 轴,在图表视图中画在右边。
注意: 只能提供axisY 或 axisYRight,不能同时提供。
另请参阅 axisY 。
borderColor : color
系列的线条(笔)颜色。
borderWidth : real
边界线的宽度。默认情况下,宽度为 2.0。
brush : brush
用于绘制该系列线条的画笔。
brushFilename : string
用作系列画笔图像的文件名。
color : color
系列的填充(画笔)颜色。
lowerSeries : LineSeries [read-only]
用于定义区域系列边界的两条线系列中较低的一条。
注: 如果AreaSeries 在构建时没有 lowerSeries,则为空。
pointLabelsClipping : bool
定义数据点标签的裁剪。默认为 True。启用剪切后,绘图区域边缘的标签将被剪切。
另请参阅 pointLabelsVisible 。
pointLabelsColor : font
定义数据点标签的颜色。默认情况下,颜色是主题中为标签定义的笔刷颜色。
另请参阅 pointLabelsFormat 。
pointLabelsFont : font
定义数据点标签使用的字体。
另请参阅 pointLabelsFormat 。
pointLabelsFormat : string
用于显示带有系列点的标签的格式。
另请参阅 QAreaSeries::pointLabelsFormat,pointLabelsVisible,pointLabelsFont, 和pointLabelsColor 。
pointLabelsVisible : bool
定义数据点标签的可见性。
另请参阅 pointLabelsFormat 和pointLabelsClipping 。
upperSeries : LineSeries [read-only]
用于定义区域系列边界的两条线系列中的上一条。
信号文档
clicked(point point)
当用户在区域图中点击point 并触发按压时,就会发出该信号。
相应的信号处理程序是onClicked 。
注: 相应的处理程序是onClicked 。
另请参阅 pressed,released, 和doubleClicked 。
doubleClicked(point point)
当用户通过双击point 来触发区域图中的第一次按压时,就会发出该信号。
相应的信号处理程序是onDoubleClicked 。
注: 相应的处理程序是onDoubleClicked 。
另请参阅 pressed,released, 和clicked 。
hovered(point point, bool state)
point 显示悬停事件的原点(坐标)。光标悬停在系列上时,true ;光标离开系列时,state 变为false。
相应的信号处理程序是onHovered 。
注: 相应的处理程序是onHovered 。
pressed(point point)
当用户按下区域图中point 指定的点时,将发出该信号。
相应的信号处理程序是onPressed 。
注: 相应的处理程序是onPressed 。
另请参阅 clicked,released, 和doubleClicked 。
released(point point)
当用户释放在point 区域图上触发的按压时,就会发出该信号。
相应的信号处理程序是onReleased 。
注: 相应的处理程序是onReleased 。
另请参阅 pressed,clicked, 和doubleClicked 。
© 2026 The Qt Company Ltd. Documentation contributions included herein are the copyrights of their respective owners. The documentation provided herein is licensed under the terms of the GNU Free Documentation License version 1.3 as published by the Free Software Foundation. Qt and respective logos are trademarks of The Qt Company Ltd. in Finland and/or other countries worldwide. All other trademarks are property of their respective owners.
