PercentBarSeries QML Type
以每类数据的百分比显示一系列分类数据。更多
| Import Statement: | import QtCharts 2.11 |
| In C++: | QPercentBarSeries |
| Inherits: |
详细说明
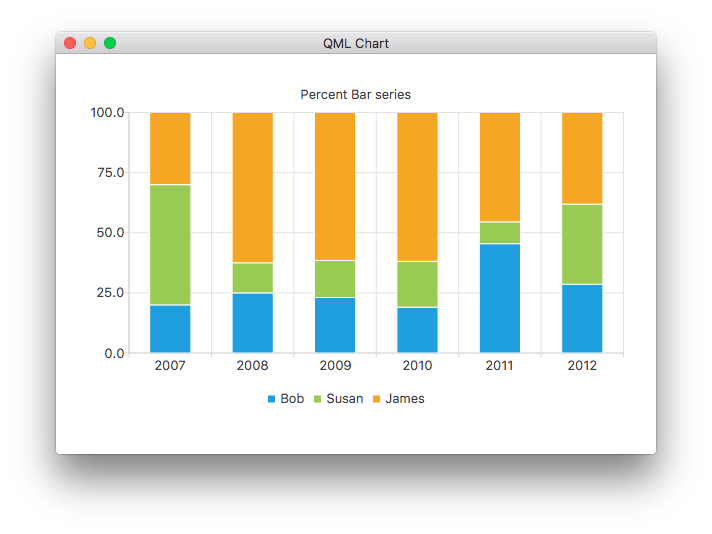
数据绘制为一系列大小一致的垂直堆叠条形图,每个类别一个条形图。添加到系列中的每个条形集都会为每个堆叠条形提供一个段。分段大小与分段值占堆栈中所有分段总值的百分比相对应。数值为零的条形图不会绘制。
下面的 QML 代码片段展示了如何创建一个简单的百分比条形图:
ChartView {
    title: "Percent Bar Chart"
    anchors.fill: parent
    legend.alignment: Qt.AlignBottom
    antialiasing: true

    PercentBarSeries {
        axisX: BarCategoryAxis { categories: ["2007", "2008", "2009", "2010", "2011", "2012" ] }
        BarSet { label: "Bob"; values: [2, 2, 3, 4, 5, 6] }
        BarSet { label: "Susan"; values: [5, 1, 2, 4, 1, 7] }
        BarSet { label: "James"; values: [3, 5, 8, 13, 5, 8] }
    }
}
© 2026 The Qt Company Ltd. Documentation contributions included herein are the copyrights of their respective owners. The documentation provided herein is licensed under the terms of the GNU Free Documentation License version 1.3 as published by the Free Software Foundation. Qt and respective logos are trademarks of The Qt Company Ltd. in Finland and/or other countries worldwide. All other trademarks are property of their respective owners.
