
StackedBarSeries QML Type
将一组数据以垂直堆叠的条形图形式呈现,每个类别对应一个条形。更多...
| Import Statement: | import QtCharts 2.12 |
| In C++: | QStackedBarSeries |
| Inherits: | |
| Status: | Deprecated |
此类型已弃用。我们强烈建议在新代码中不要使用它。
详细说明
添加到数据系列中的每个条形集都会为每个堆叠条形图贡献一个条段。
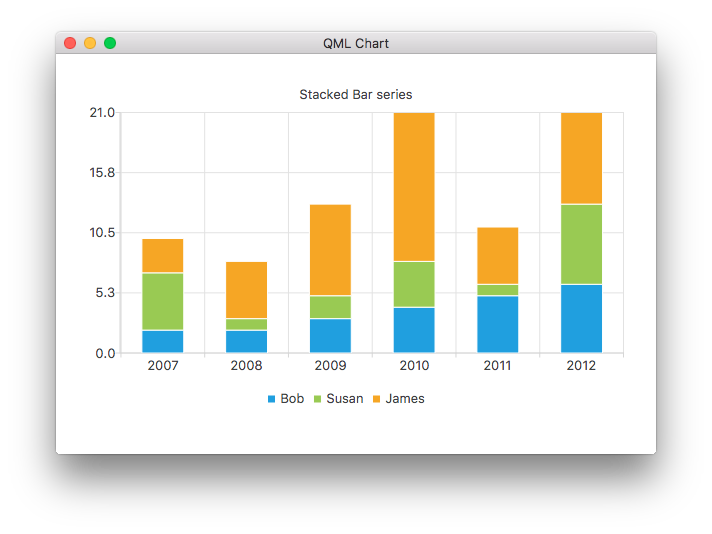
以下 QML 代码演示了如何创建一个简单的堆叠条形图:
ChartView {
    title: "Stacked Bar Chart"
    anchors.fill: parent
    legend.alignment: Qt.AlignBottom
    antialiasing: true

    StackedBarSeries {
        axisX: BarCategoryAxis { categories: ["2007", "2008", "2009", "2010", "2011", "2012" ] }
        BarSet { label: "Bob"; values: [2, 2, 3, 4, 5, 6] }
        BarSet { label: "Susan"; values: [5, 1, 2, 4, 1, 7] }
        BarSet { label: "James"; values: [3, 5, 8, 13, 5, 8] }
    }
}
© 2026 The Qt Company Ltd. Documentation contributions included herein are the copyrights of their respective owners. The documentation provided herein is licensed under the terms of the GNU Free Documentation License version 1.3 as published by the Free Software Foundation. Qt and respective logos are trademarks of The Qt Company Ltd. in Finland and/or other countries worldwide. All other trademarks are property of their respective owners.
