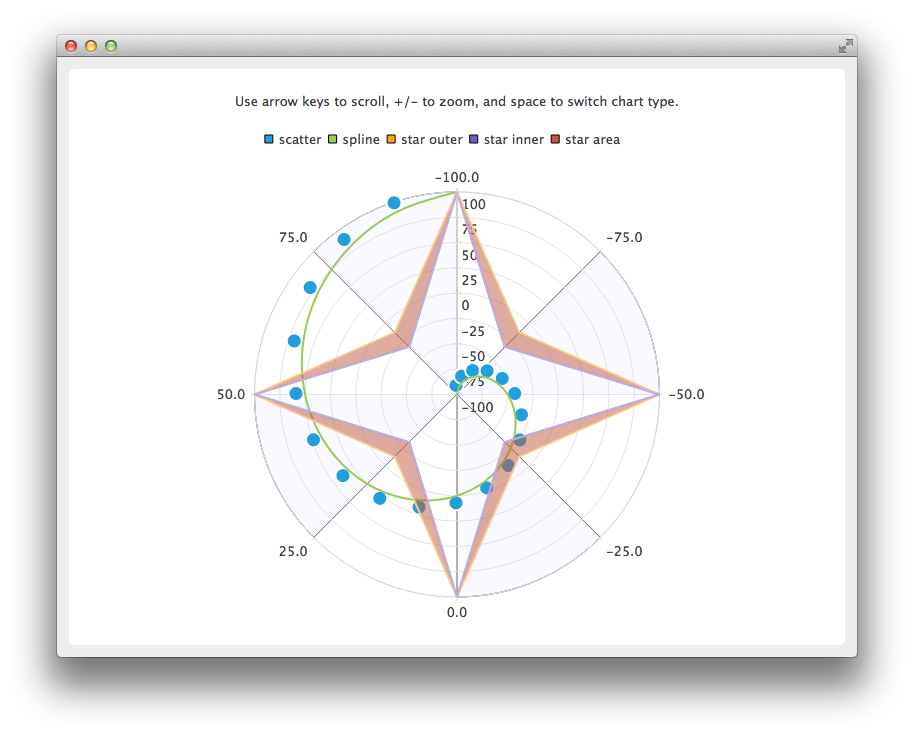
创建极坐标图
注: 这是带 Widgets 图库的图表示例的一部分。
它还展示了如何实现极坐标图的滚动和缩放,并直观演示了极坐标图和笛卡尔图之间的关系。

创建极坐标图时使用的是QPolarChart 实例,而不是QChart 实例。
auto chart = new QPolarChart;
创建坐标轴的方法与笛卡尔图表类似,但在向图表添加坐标轴时,可以使用极坐标方向而不是排列方式。
auto angularAxis = new QValueAxis;
angularAxis->setTickCount(9); // First and last ticks are co-located on 0/360 angle.
angularAxis->setLabelFormat("%.1f");
angularAxis->setShadesVisible(true);
angularAxis->setShadesBrush(QBrush(QColor(249, 249, 255)));
chart->addAxis(angularAxis, QPolarChart::PolarOrientationAngular);

auto radialAxis = new QValueAxis;
radialAxis->setTickCount(9);
radialAxis->setLabelFormat("%d");
chart->addAxis(radialAxis, QPolarChart::PolarOrientationRadial);
极坐标图表的缩放和滚动在逻辑上与笛卡尔图表的缩放和滚动几乎相同。主要区别在于沿 X 轴(角度轴)滚动时,使用的是角度而不是像素数。另一个区别是不能缩放至矩形区域。
void PolarChartView::keyPressEvent(QKeyEvent *event)
{
    switch (event->key()) {
    case Qt::Key_Plus:
        chart()->zoomIn();
        break;
    case Qt::Key_Minus:
        chart()->zoomOut();
        break;
    case Qt::Key_Left:
        chart()->scroll(-1.0, 0);
        break;
    case Qt::Key_Right:
        chart()->scroll(1.0, 0);
        break;
    case Qt::Key_Up:
        chart()->scroll(0, 1.0);
        break;
    case Qt::Key_Down:
        chart()->scroll(0, -1.0);
        break;
    case Qt::Key_Space:
        switchChartType();
        break;
    default:
        QGraphicsView::keyPressEvent(event);
        break;
    }
}
在直角坐标图和极坐标图中可以使用相同的坐标轴和序列,但不能同时使用。要在图表类型之间切换,首先需要删除旧图表中的系列和坐标轴,然后将其添加到新图表中。如果要保留坐标轴范围,也需要将其复制。
void PolarChartView::switchChartType()
{
    QChart *newChart;
    QChart *oldChart = chart();

    if (oldChart->chartType() == QChart::ChartTypeCartesian)
        newChart = new QPolarChart;
    else
        newChart = new QChart;

    // Move series and axes from old chart to new one
    const QList<QAbstractSeries *> seriesList = oldChart->series();
    const QList<QAbstractAxis *> axisList = oldChart->axes();
    QList<QPair<qreal, qreal> > axisRanges;

    for (QAbstractAxis *axis : axisList) {
        auto valueAxis = static_cast<QValueAxis *>(axis);
        axisRanges.append(QPair<qreal, qreal>(valueAxis->min(), valueAxis->max()));
    }

    for (QAbstractSeries *series : seriesList)
        oldChart->removeSeries(series);

    for (QAbstractAxis *axis : axisList) {
        oldChart->removeAxis(axis);
        newChart->addAxis(axis, axis->alignment());
    }

    for (QAbstractSeries *series : seriesList) {
        newChart->addSeries(series);
        for (QAbstractAxis *axis : axisList)
            series->attachAxis(axis);
    }

    int count = 0;
    for (QAbstractAxis *axis : axisList) {
        axis->setRange(axisRanges[count].first, axisRanges[count].second);
        count++;
    }

    newChart->setTitle(oldChart->title());
    setChart(newChart);
    delete oldChart;
}
© 2025 The Qt Company Ltd. Documentation contributions included herein are the copyrights of their respective owners. The documentation provided herein is licensed under the terms of the GNU Free Documentation License version 1.3 as published by the Free Software Foundation. Qt and respective logos are trademarks of The Qt Company Ltd. in Finland and/or other countries worldwide. All other trademarks are property of their respective owners.

