驾驶舱
使用图形模仿飞机驾驶舱的示例应用程序。
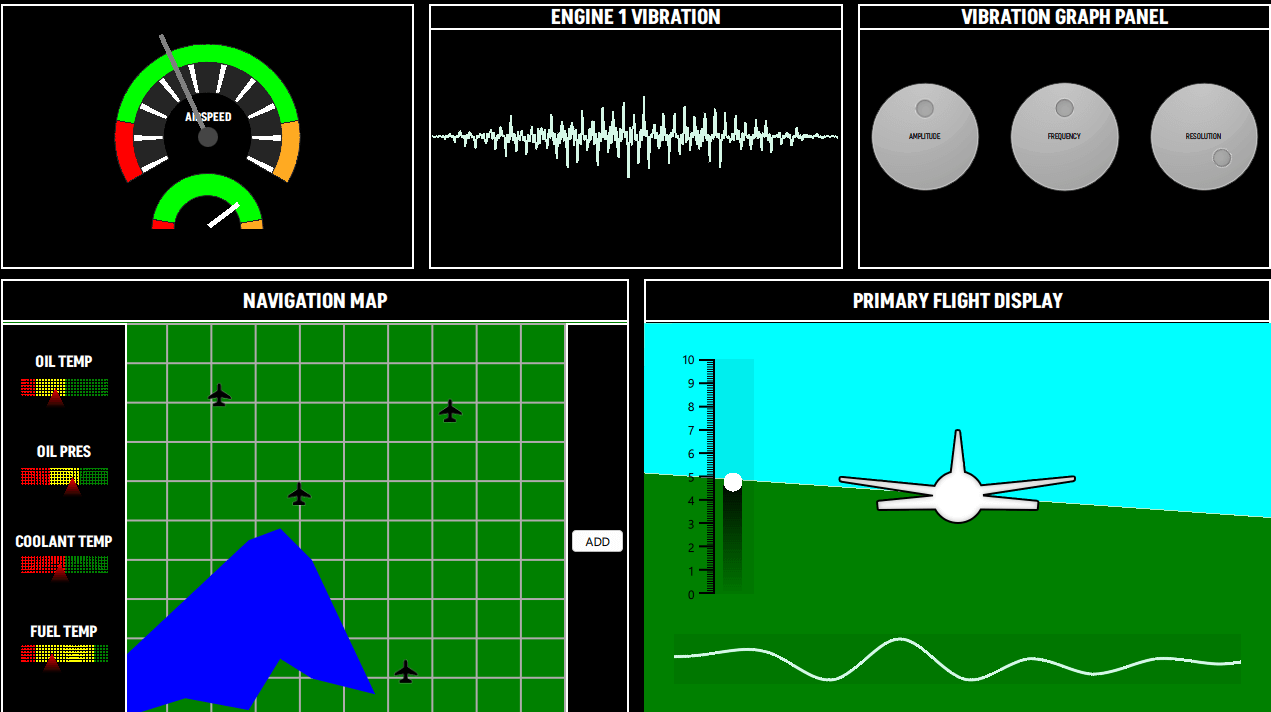
驾驶舱示例使用多种不同类型的图形绘制虚构的飞机控制屏幕。示例中使用的图形包括
- PieSeries (速度计)
- LineSeries (振动面板、导航地图)
- AreaSeries (导航地图、主飞行显示器)
- BarSeries (导航地图,主飞行显示器)
- ScatterSeries (导航地图)
- SplineSeries (主飞行显示器)
运行示例
要运行来自 Qt Creator,打开Welcome 模式并从Examples 中选择示例。更多信息,请参阅Qt Creator: 教程:构建并运行。
速度计
速度计视图由单个GraphsView 内的 3 个PieSeries 组成,两个表盘均使用 QML 矩形作为指针。
GraphsTheme 的backgroundVisible属性设置为false 。所有PieSlices 都有自己的自定义颜色。为显示中心空心的圆形刻度,示例使用了具有不同孔径大小的 PieSeries 。
GraphsView {
    id: chart
    anchors.fill: parent
    anchors.margins: 20

    theme: GraphsTheme {
        backgroundVisible: false
        borderColors: ["#252525"]
    }

    PieSeries {
        id: pieOuter
        pieSize: 1
        holeSize: 0.8
        startAngle: -120
        endAngle: 120

        PieSlice { label: "Stall"; value: 1; color: "#ff0000"; labelVisible: false }
        PieSlice { label: "Optimal"; value: 4; color: "#00ff00"; labelVisible: false }
        PieSlice { label: "Overspeed"; value: 1; color: "#ffaa22"; labelVisible: false }
    }

    PieSeries {
        pieSize: 0.8
        holeSize: 0.6
        startAngle: -120
        endAngle: 120

        PieSlice { value: 1; color: "#ffffff"; }
        PieSlice { value: 4; color: "#252525"; }
        PieSlice { value: 1; color: "#ffffff"; }
        PieSlice { value: 4; color: "#252525"; }
        PieSlice { value: 1; color: "#ffffff"; }
        PieSlice { value: 4; color: "#252525"; }
        PieSlice { value: 1; color: "#ffffff"; }
        PieSlice { value: 4; color: "#252525"; }
        PieSlice { value: 1; color: "#ffffff"; }
        PieSlice { value: 4; color: "#252525"; }
        PieSlice { value: 1; color: "#ffffff"; }
        PieSlice { value: 4; color: "#252525"; }
        PieSlice { value: 1; color: "#ffffff"; }
        PieSlice { value: 4; color: "#252525"; }
        PieSlice { value: 1; color: "#ffffff"; }
        PieSlice { value: 4; color: "#252525"; }
        PieSlice { value: 1; color: "#ffffff"; }
        PieSlice { value: 4; color: "#252525"; }
        PieSlice { value: 1; color: "#ffffff"; }
    }

    PieSeries {
        pieSize: 0.6
        holeSize: 1.0
        startAngle: -120
        endAngle: 120
        verticalPosition: 1

        PieSlice { label: "Stall"; value: 1; color: "#ff0000"; labelVisible: false }
        PieSlice { label: "Optimal"; value: 4; color: "#00ff00"; labelVisible: false  }
        PieSlice { label: "Overspeed"; value: 1; color: "#ffaa22"; labelVisible: false  }
    }
}
振动面板
振动面板包含一个在运行时动态更新的LineSeries 。启动后,使用 QML 调用的append函数将一组点添加到系列中。然后在每一帧中,使用replace函数用计算值替换这些值。用户可以通过振动图面板更改这些值。
LineSeries {
    id: line
    property int divisions: 500
    property real amplitude: 0.5
    property real resolution: 0.5

    FrameAnimation {
        running: true

        onTriggered: {
            for (let i = 0; i < line.divisions; ++i) {
                let y = Math.sin(line.resolution*i)
                y *= Math.cos(i)
                y *= Math.sin(i / line.divisions * 3.2) * 3 * line.amplitude * Math.random()

               line.replace(i, (i/line.divisions) * 8.0, y + 4)
            }
        }
    }

    Component.onCompleted: {
        for (let i = 1; i <= divisions; ++i) {
            append((i/divisions) * 8.0, 4.0)
        }
    }

    function change(newDivs) {
        let delta = newDivs - divisions

        if (delta < 0) {
            delta = Math.abs(delta)
            removeMultiple(count - 1 - delta, delta)
        } else {
            for (let i = 0; i < delta; ++i) {
                append(((count + i)/divisions) * 8.0, 4.0)
            }
        }

        divisions = newDivs
    }
}
振动图面板
该面板包含控制旋钮,用于调整影响振动面板中显示的可视化效果的值。
导航地图
导航图有两个主要部分:
- 左侧面板包含多个BarSeries ,其中的自定义着色器利用BarSets 颜色对每个条形图进行着色。
BarSeries {
    property real barOpacity: 0.

    id: barSeries
    barsType: BarSeries.BarsType.Stacked
    barWidth: 0.2

    barDelegate: Item {
        id: delegate
        antialiasing: true
        property real barOpacity: 0.5
        property color barColor
        property string barLabel

        FrameAnimation {
            running: true
            onTriggered: {
                delegate.barOpacity = Math.abs(Math.sin(elapsedTime))
            }
        }
        ShaderEffect {
            id: effect
            readonly property alias iTime: delegate.barOpacity
            readonly property alias iColor: delegate.barColor
            readonly property vector3d iResolution: Qt.vector3d(width, height, 1.0)

            blending: true
            fragmentShader: 'bar.frag.qsb'
            anchors.fill: parent
        }
    }

    BarSet { id: set1; label: "Low"; values: [1, 2, 3, 1]; color: "red" }
    BarSet { id: set2; label: "Medium"; values: [2, 2, 0, 4]; color: "yellow"}
    BarSet { id: set3; label: "High"; values: [3, 2, 3, 1]; color: "green"}
}
- 右侧面板包含:
- 带有两个LineSeries 的AreaSeries 显示了一个虚构的湖泊。
- 上面的ScatterSeries 在地图上显示自定义图标,例如机场。
- ADD按钮可添加一个LineSeries ,其点可随意移动以创建路径。LineSeries 的pointDelegate使用自定义着色器,而ScatterSeries 则使用图像。
AreaSeries {
    property double x: 0
    property double y: 0

    id: lake1
    color: "blue"
    upperSeries: LineSeries {
        id: s1
        XYPoint { x: 0.0; y: -3.5 }
        XYPoint { x: 1.0; y: -5.0 }
        XYPoint { x: 2.0; y: -2.5 }
        XYPoint { x: 2.5; y: -4.0 }
        XYPoint { x: 3.0; y: -4.2 }
    }

    lowerSeries: LineSeries {
        id: s2
        XYPoint { x: 0.0; y: -7.2 }
        XYPoint { x: 1.0; y: -7.0 }
        XYPoint { x: 2.0; y: -8.5 }
        XYPoint { x: 2.5; y: -8.0 }
        XYPoint { x: 3.0; y: -9.0 }
        XYPoint { x: 4.0; y: -6.5 }
    }
}

AreaSeries {
    property double x: 0
    property double y: 0

    id: lake2
    color: "blue"
    upperSeries: LineSeries {
        id: s3
        XYPoint { x: 0.0; y: 1.5 }
        XYPoint { x: 1.0; y: 3.0 }
        XYPoint { x: 2.0; y: 4.5 }
        XYPoint { x: 2.5; y: 4.8 }
        XYPoint { x: 3.0; y: 4.0 }
    }

    lowerSeries: LineSeries {
        id: s4
        XYPoint { x: 0.0; y: 0.0 }
        XYPoint { x: 1.0; y: 0.5 }
        XYPoint { x: 2.0; y: 0.2 }
        XYPoint { x: 2.5; y: 1.5 }
        XYPoint { x: 3.0; y: 1.0 }
        XYPoint { x: 4.0; y: 0.6 }
    }
}

// POI
ScatterSeries {
    name: "Airport"

    pointDelegate: Image {
            source: "airplane-ico.png"
            mipmap: true
            width: 30
            height: 30
    }

    XYPoint{x: 4.0; y: 5.7}
    XYPoint{x: 2.2; y: 8.2}
    XYPoint{x: 6.4; y: 1.2}
    XYPoint{x: 7.4; y: 7.8}
}

LineSeries {
    id: linePath
    selectable: true
    draggable: true
    color: "white"
    pointDelegate: Item {
        width: 50
        height: 50
        property real pointValueX
        property real pointValueY

        FrameAnimation {
            id: scatterAnim
            running: true
        }

        ShaderEffect {
            readonly property vector3d iResolution: Qt.vector3d(width, height, 1.0)
            readonly property alias iTime: scatterAnim.elapsedTime

            blending: true
            fragmentShader: 'circleMarker.frag.qsb'
            anchors.fill: parent
        }

        Text {
            color: "white"
            font.pointSize: 4
            text: "LAT: " + pointValueX.toFixed(1) + ", " + "LON: " + pointValueY.toFixed(1)
        }
    }
}
主飞行显示屏
主飞行显示屏的特点是模仿地形的 "3D "视图。它由两个AreaSeries 实现,分别代表地面和天空,每种颜色均可自定义。FrameAnimation 会更新这些系列的值。
AreaSeries {
    id: upperArea
    color: "cyan"

    upperSeries: LineSeries {
        XYPoint {x: 0; y: 10}
        XYPoint {x: 10; y: 10}
    }

    lowerSeries: LineSeries {
        id: upperLine
        XYPoint {x: 0; y: 3}
        XYPoint {x: 10; y: 4}
    }
}

FrameAnimation {
    running: true
    onTriggered: {
        upperLine.replace(0, upperLine.at(0).x, Math.sin(elapsedTime) + 6)
        upperLine.replace(1, upperLine.at(1).x, Math.cos(elapsedTime) + 6)
        lowerLine.replace(0, lowerLine.at(0).x, Math.sin(elapsedTime) + 6)
        lowerLine.replace(1, lowerLine.at(1).x, Math.cos(elapsedTime) + 6)
        barSet.values = [Math.sin(elapsedTime) + 5]
    }
}
在左侧,一个主题BarSeries 显示 Y 轴标签。该BarSeries 还为条形图使用了自定义着色器。
BarSeries {
    id: barSeries
    selectable: true
    barDelegate: Item {
        id: delegate
        antialiasing: true
        property real barOpacity: 0.5
        property color barColor
        property string barLabel

        ShaderEffect {
            id: effect
            readonly property vector3d iResolution: Qt.vector3d(width, height, 1.0)

            blending: true
            fragmentShader: 'pitchbar.frag.qsb'
            anchors.fill: parent
        }
    }

    BarSet { id: barSet; values: []; selectedColor: "red" }
}
在视图底部,SplineSeries 可视化显示飞机下方的地形高度。SplineSeries 在每一帧都会更新。更新一系列点的代码会在后面添加,并从前面删除一系列连续的点。悬停时,SplineSeries 会显示一个工具提示,显示 y 轴值(高度)。
GraphsView {
    anchors.fill: parent
    anchors.leftMargin: -90
    anchors.rightMargin: -80
    anchors.bottomMargin: -30

    theme: GraphsTheme {
        backgroundVisible: false
        plotAreaBackgroundColor: "#11000000"
    }

    axisX: ValueAxis {
        max: 10
        subTickCount: 9
        lineVisible: false
        gridVisible: false
        subGridVisible: false
        labelsVisible: false
        visible: false
    }

    axisY: ValueAxis {
        max: 10
        subTickCount: 9
        lineVisible: false
        gridVisible: false
        subGridVisible: false
        labelsVisible: false
        visible: false
    }

    ToolTip {
        id: tooltip
    }

    onHoverEnter: {
        tooltip.visible = true;
    }

    onHoverExit: {
        tooltip.visible = false;
    }

    onHover: (seriesName, position, value) => {
                 tooltip.x = position.x + 1;
                 tooltip.y = position.y + 1;
                 tooltip.text = "Altitude: " + (value.y * 1000).toFixed(1) + "m";
             }

    FrameAnimation {
        property var points: []

        Component.onCompleted: {
            for (let i = 0; i < altitudeLine.count; ++i) {
                points[i] = altitudeLine.at(i)
            }
        }

        running: true
        onTriggered: {
            for (let i = 0; i < points.length; ++i) {
                points[i].x -= frameTime

                if (points[1].x <= -2) {
                    let p = points[0]
                    p.x = points[points.length - 1].x + 1
                    altitudeLine.append(p)
                    altitudeLine.remove(0)

                    points.length = 0

                    for (let i = 0; i < altitudeLine.count; ++i) {
                        points[i] = altitudeLine.at(i)
                    }
                }
            }
            altitudeLine.replace(points)
            altitudeLine.update()
        }
    }

    SplineSeries {
        id: altitudeLine
        hoverable: true
        width: 3

        XYPoint {x: 0; y: 5}
        XYPoint {x: 1; y: 2}
        XYPoint {x: 2; y: 5}
        XYPoint {x: 3; y: 4}
        XYPoint {x: 4; y: 6}
        XYPoint {x: 5; y: 7}
        XYPoint {x: 6; y: 9}
        XYPoint {x: 7; y: 8}
        XYPoint {x: 8; y: 9}
        XYPoint {x: 9; y: 6}
        XYPoint {x: 10; y: 6}
        XYPoint {x: 11; y: 6}
        XYPoint {x: 12; y: 1}
        XYPoint {x: 13; y: 9}
        XYPoint {x: 14; y: 1}
    }

}
© 2026 The Qt Company Ltd. Documentation contributions included herein are the copyrights of their respective owners. The documentation provided herein is licensed under the terms of the GNU Free Documentation License version 1.3 as published by the Free Software Foundation. Qt and respective logos are trademarks of The Qt Company Ltd. in Finland and/or other countries worldwide. All other trademarks are property of their respective owners.
