数学公式
可视化数学方程。
Mathematical Equations(数学公式)展示了如何在 QML 中使用所有可用的图形类型来可视化数学公式。它还展示了如何将QtQuick3D 场景集成到图形中,以及如何使用ExtendedSceneEnvironment 调整图形的外观。
有关 QML 应用程序基本功能的更多信息,请参阅Simple Scatter Graph(简单散点图)。
运行示例
运行示例 Qt Creator,打开Welcome 模式,并从Examples 选择示例。更多信息,请参阅Qt Creator: 教程:构建并运行。
设置
所有图表类型的数据都可以存储在一个共同的ListModel 中:
ListModel {
    id: dataModel
}
在图表系列中为每种图表类型设置模型:
Surface3DSeries {
    id: surfaceSeries
    itemLabelFormat: "(@xLabel, @zLabel): @yLabel"

    ItemModelSurfaceDataProxy {
        itemModel: dataModel
        columnRole: "xPos"
        yPosRole: "yPos"
        rowRole: "zPos"
    }
}
...
Bar3DSeries {
    id: barSeries
    itemLabelFormat: "@colLabel, @rowLabel: @valueLabel"

    ItemModelBarDataProxy {
        itemModel: dataModel
        columnRole: "xPos"
        valueRole: "yPos"
        rowRole: "zPos"
    }
}
...
Scatter3DSeries {
    id: scatterSeries
    itemLabelFormat: "(@xLabel, @zLabel): @yLabel"
    mesh: Abstract3DSeries.Mesh.Point

    ItemModelScatterDataProxy {
        itemModel: dataModel
        xPosRole: "xPos"
        yPosRole: "yPos"
        zPosRole: "zPos"
    }
}
设置角色可将模型中的数据自动映射到相应的坐标轴上。
解析方程
可以使用以下运算符和数学函数以及使用这些函数所需的字符在文本字段中输入等式:
| 运算符 | 函数 | 字符 |
|---|---|---|
| + - * / % ^ | sin cos tan log exp sqrt | ( ) , |
支持x 和y 作为参数,因为处理的数据有两个坐标轴和数值。等式的运算符周围可能有空格,因此以下两种样式都可以:
- x^2+y^2
- x ^ 2 + y ^ 2
方程使用 JavaScript 方程解析器和计算器进行解析,并导入到 QML 中:
import "calculator.js" as Calc
该计算器由tanguy_k 以TypeScript 发布到Stack Overflow,并已转换为 JavaScript,以便从 QML 使用。
每次方程改变或列或行计数更新时,方程参数都会被填入。
循环显示行和列:
for (i = xValues.first.value; i <= xValues.second.value; ++i) {
    for (j = zValues.first.value; j <= zValues.second.value; ++j)
        addDataPoint(i, j)
}
填写x 和y 的值:
function addDataPoint(i, j) {
    var filledEquation = equation.text.replace("x", i)
    filledEquation = filledEquation.replace("y", j)
    ...
然后将等式传递给 JavaScript 计算器以获得结果,然后通过将其插入定义的角色将其添加到数据模型中:
try {
    var result = Calc.calculate(filledEquation)
    dataModel.append({"xPos": i, "yPos": result, "zPos": j})
}
如果等式中出现错误或未知运算符或数学函数,计算器会捕捉到错误并显示错误对话框:
MessageDialog {
    id : messageDialog
    title: qsTr("Error")
    text: qsTr("Undefined behavior")
    ...
显示计算器的错误信息:
catch(msg) {
    messageDialog.informativeText = msg.toString()
    messageDialog.open()
}
图表
三种图形类型使用相同的数据模型。不过图形的设置还是有一些区别的。
曲面图
曲面图用于显示数据,无需任何特定修改。它会在每一行和每一列显示等式和计算结果。
唯一的变化是设置轴段计数:
axisX.segmentCount: 10
axisZ.segmentCount: 10
axisY.segmentCount: 10
为主题设置了范围梯度,以突出高值和低值:
theme : GraphsTheme {
    id: surfaceTheme
    colorStyle: GraphsTheme.ColorStyle.RangeGradient
    baseGradients: [ gradient1 ]
    plotAreaBackgroundVisible: false
}
梯度本身定义在其他地方,以便其他主题使用。
条形图
条形图也使用范围渐变。该渐变利用了轻微的透明度,以便在不旋转图表的情况下更容易看到数值。添加了一个滑块来控制透明度的高低。
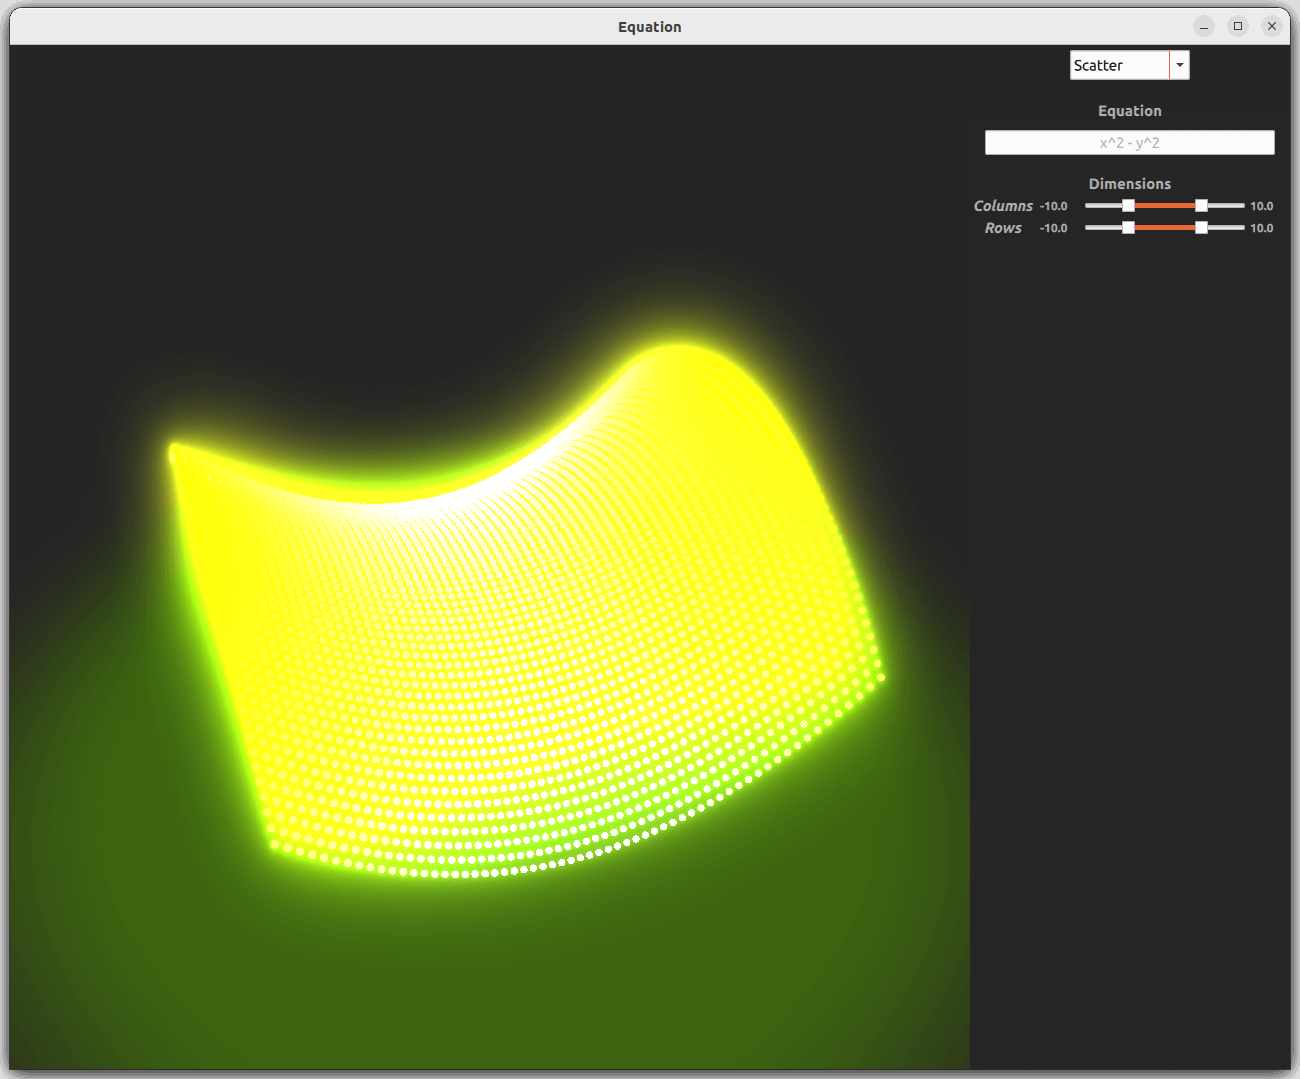
散点图
为了准备QtQuick3D 集成,散点图的主题做了一些调整。
首先,它将使用与其他两个不同的渐变色。然后,它将强制使用深色方案,这与使用系统偏好的其他两种方案不同。最后,将绘图区域背景、标签和网格的可见性设置为 false,从而隐藏它们。
散点图善于显示大量数据点,这就是为什么每个 "行 "和 "列 "都会添加 3 个数据点。散点图没有行和列的概念,因此可以这样做:
for (var i = xValues.first.value; i <= xValues.second.value; i += 0.333) {
    for (var j = zValues.first.value; j <= zValues.second.value; j += 0.333)
        addDataPoint(i, j)
}
由于散点图的数据点要比其他两个图多很多,因此最好使用最轻的mesh type 来表示这些点:
mesh: Abstract3DSeries.Mesh.Point
集成 QtQuick3D 场景
要找到QtQuick3D 类型,必须将其导入 QML:
import QtQuick3D
可使用importScene 属性将QtQuick3D 场景导入图形。该场景可以是Models、Lights、reflection probes 以及包含在根Node 中的其他Nodes 的组合。在本例中,只添加了一个带有不透明度贴图的矩形:
importScene: Node {
    Model {
        scale: Qt.vector3d(0.1, 0.1, 0.1)
        source: "#Rectangle"
        y: -2
        eulerRotation.x: -90
        materials: [
            PrincipledMaterial {
                baseColor: "#373F26"
                opacityMap: Texture {
                    source: "qrc:/images/opacitymap.png"
                }
            }
        ]
    }
}
使用 QtQuick3D 更改外观
要找到ExtendedSceneEnvironment ,需要进行以下导入:
import QtQuick3D.Helpers
要覆盖图形的默认场景环境,需要在environment 属性中添加ExtendedSceneEnvironment 。在此例中,设置了backgroundMode 、clearColor 和tonemapMode 。此外,还启用了glow 。要添加辉光等后期处理效果,需要将色调贴图模式设置为TonemapModeNone 。
environment: ExtendedSceneEnvironment {
    backgroundMode: ExtendedSceneEnvironment.Color
    clearColor: scatterTheme.backgroundColor
    tonemapMode: ExtendedSceneEnvironment.TonemapModeNone
    glowEnabled: true
    ...
为使发光效果更强,还需设置其他几个相关属性。
© 2026 The Qt Company Ltd. Documentation contributions included herein are the copyrights of their respective owners. The documentation provided herein is licensed under the terms of the GNU Free Documentation License version 1.3 as published by the Free Software Foundation. Qt and respective logos are trademarks of The Qt Company Ltd. in Finland and/or other countries worldwide. All other trademarks are property of their respective owners.
