
Previous topic
Next topic
QXYSeries
The QXYSeries class is a base class for line, spline, and scatter series. More…
Inherited by: QScatterSeries, QLineSeries, QSplineSeries
Synopsis
Functions
def
__lshift__(point)def
__lshift__(points)def
append(point)def
append(points)def
append(x, y)def
appendNp(x, y)def
at(index)def
bestFitLineColor()def
bestFitLineEquation(ok)def
bestFitLinePen()def
bestFitLineVisible()def
brush()def
clear()def
clearPointConfiguration(index)def
clearPointConfiguration(index, key)def
clearPointsConfiguration()def
clearPointsConfiguration(key)def
colorBy(sourceData[, gradient=QLinearGradient()])def
count()def
deselectAllPoints()def
deselectPoint(index)def
deselectPoints(indexes)def
insert(index, point)def
isPointSelected(index)def
lightMarker()def
markerSize()def
pen()def
pointConfiguration(index)def
pointLabelsClipping()def
pointLabelsColor()def
pointLabelsFont()def
pointLabelsFormat()def
pointLabelsVisible()def
points()def
pointsConfiguration()def
pointsVector()def
pointsVisible()def
remove(index)def
remove(point)def
remove(x, y)def
removePoints(index, count)def
replace(index, newPoint)def
replace(index, newX, newY)def
replace(oldPoint, newPoint)def
replace(oldX, oldY, newX, newY)def
replace(points)def
replaceNp(x, y)def
selectAllPoints()def
selectPoint(index)def
selectPoints(indexes)def
selectedColor()def
selectedLightMarker()def
selectedPoints()def
setBestFitLineColor(color)def
setBestFitLinePen(pen)def
setBestFitLineVisible([visible=true])def
setLightMarker(lightMarker)def
setMarkerSize(size)def
setPointConfiguration(index, configuration)def
setPointConfiguration(index, key, value)def
setPointLabelsClipping([enabled=true])def
setPointLabelsColor(color)def
setPointLabelsFont(font)def
setPointLabelsFormat(format)def
setPointLabelsVisible([visible=true])def
setPointSelected(index, selected)def
setPointsConfiguration(pointsConfiguration)def
setPointsVisible([visible=true])def
setSelectedColor(color)def
setSelectedLightMarker(selectedLightMarker)def
sizeBy(sourceData, minSize, maxSize)def
toggleSelection(indexes)
Virtual functions
Signals
def
bestFitLineColorChanged(color)def
bestFitLinePenChanged(pen)def
bestFitLineVisibilityChanged(visible)def
clicked(point)def
colorChanged(color)def
doubleClicked(point)def
hovered(point, state)def
lightMarkerChanged(lightMarker)def
markerSizeChanged(size)def
penChanged(pen)def
pointAdded(index)def
pointLabelsClippingChanged(clipping)def
pointLabelsColorChanged(color)def
pointLabelsFontChanged(font)def
pointLabelsFormatChanged(format)def
pointLabelsVisibilityChanged(visible)def
pointRemoved(index)def
pointReplaced(index)def
pointsConfigurationChanged(configuration)def
pointsRemoved(index, count)def
pointsReplaced()def
pressed(point)def
released(point)def
selectedColorChanged(color)def
selectedLightMarkerChanged(selectedLightMarker)def
selectedPointsChanged()
Detailed Description
QXYSeries supports displaying best fit line on a chart. Best fit line is a line through a chart that expresses the relationship between points.
- class PySide6.QtCharts.QXYSeries
- PySide6.QtCharts.QXYSeries.PointConfiguration
This enum value describes the particular configuration of a point.
Constant
Description
QXYSeries.PointConfiguration.Color
This enum value can be used to change a point’s color. If used together with
setPointConfiguration, the configuration’s value should be a validQColor.QXYSeries.PointConfiguration.Size
This enum value can be used to change a point’s size. If used together with
setPointConfiguration, the configuration’s value should be a number, such asqrealorint.QXYSeries.PointConfiguration.Visibility
This enum value can be used to hide or show the point. If used together with
setPointConfiguration, the configuration’s value should be boolean.QXYSeries.PointConfiguration.LabelVisibility
This enum value can be used to hide or show the label of the point. If used together with
setPointConfiguration, the configuration’s value should be boolean.See also
- PySide6.QtCharts.QXYSeries.append(point)
- Parameters
point –
PySide6.QtCore.QPointF
This is an overloaded function.
Adds the data point point to the series.
- PySide6.QtCharts.QXYSeries.append(points)
- Parameters
points –
- PySide6.QtCharts.QXYSeries.append(x, y)
- Parameters
x – float
y – float
Adds the data point with the coordinates x and y to the series.
- PySide6.QtCharts.QXYSeries.appendNp(x, y)
- Parameters
x –
PyArrayObjecty –
PyArrayObject
Adds the list of data points specified by two one-dimensional, equally sized numpy arrays representing the x, y values, respectively.
- PySide6.QtCharts.QXYSeries.at(index)
- Parameters
index – int
- Return type
Returns the data point at the position specified by index in the internal series of points.
- PySide6.QtCharts.QXYSeries.bestFitLineColor()
- Return type
This property holds The color of best fit line..
See also
- PySide6.QtCharts.QXYSeries.bestFitLineColorChanged(color)
- Parameters
color –
PySide6.QtGui.QColor
- PySide6.QtCharts.QXYSeries.bestFitLineEquation(ok)
- Parameters
ok – bool
- Return type
Returns a pair of numbers where the first number is a slope factor and the second number is intercept of a linear function for a best fit line.
Those factors are calculated using Least Squares Method based on points passed to the series.
Parameter ok is used to report a failure by setting its value to false and to report a success by setting its value to true.
See also
- PySide6.QtCharts.QXYSeries.bestFitLinePen()
- Return type
- PySide6.QtCharts.QXYSeries.bestFitLinePenChanged(pen)
- Parameters
pen –
PySide6.QtGui.QPen
- PySide6.QtCharts.QXYSeries.bestFitLineVisibilityChanged(visible)
- Parameters
visible – bool
- PySide6.QtCharts.QXYSeries.bestFitLineVisible()
- Return type
bool
This property holds The visibility of the best fit line..
This property is false by default.
See also
- PySide6.QtCharts.QXYSeries.brush()
- Return type
Returns the brush used to fill the data points for the series.
See also
- PySide6.QtCharts.QXYSeries.clear()
Removes all points from the series.
See also
- PySide6.QtCharts.QXYSeries.clearPointConfiguration(index, key)
- Parameters
index – int
key –
PointConfiguration
Removes the configuration property identified by key from the point at index and restores the default look derived from the series’ settings.
Removes the configuration type, such as color or size, specified by key from the point at index with configuration customizations, allowing that configuration property to be rendered as the default specified in the series’ properties.
Note
It doesn’t affect the configuration of other points.
- PySide6.QtCharts.QXYSeries.clearPointConfiguration(index)
- Parameters
index – int
Removes the configuration of a point located at index and restores the default look derived from the series’ settings.
Note
It doesn’t affect the configuration of other points.
- PySide6.QtCharts.QXYSeries.clearPointsConfiguration()
Removes the configuration of all points in the series and restores the default look derived from the series’ settings.
See also
- PySide6.QtCharts.QXYSeries.clearPointsConfiguration(key)
- Parameters
key –
PointConfiguration
Removes the configuration property identified by key from all points and restores the default look derived from the series’ settings.
Removes the configuration type, such as color or size, specified by key from all points with configuration customizations, allowing that configuration property to be rendered as the default specified in the series properties.
- PySide6.QtCharts.QXYSeries.clicked(point)
- Parameters
point –
PySide6.QtCore.QPointF
- PySide6.QtCharts.QXYSeries.color()
- Return type
This property holds The color of the series..
This is the line (pen) color in case of QLineSeries or QSplineSeries and the fill (brush) color in case of QScatterSeries or QAreaSeries .
- PySide6.QtCharts.QXYSeries.colorBy(sourceData[, gradient=QLinearGradient()])
- Parameters
sourceData –
gradient –
PySide6.QtGui.QLinearGradient
Sets the points’ color according to a passed list of values. Values from sourceData are sorted and mapped to the gradient.
If the series has a QColorAxis attached, then a gradient from the axis is going to be used.
See also
setPointConfiguration()pointConfiguration()QColorAxis
- PySide6.QtCharts.QXYSeries.colorChanged(color)
- Parameters
color –
PySide6.QtGui.QColor
- PySide6.QtCharts.QXYSeries.count()
- Return type
int
Returns the number of data points in a series.
- PySide6.QtCharts.QXYSeries.deselectAllPoints()
Deselects all points in the series.
- PySide6.QtCharts.QXYSeries.deselectPoint(index)
- Parameters
index – int
Deselects point at given index.
- PySide6.QtCharts.QXYSeries.deselectPoints(indexes)
- Parameters
indexes –
Marks multiple points passed in a indexes list as deselected.
- PySide6.QtCharts.QXYSeries.doubleClicked(point)
- Parameters
point –
PySide6.QtCore.QPointF
- PySide6.QtCharts.QXYSeries.hovered(point, state)
- Parameters
point –
PySide6.QtCore.QPointFstate – bool
- PySide6.QtCharts.QXYSeries.insert(index, point)
- Parameters
index – int
point –
PySide6.QtCore.QPointF
Inserts the data point point in the series at the position specified by index.
See also
- PySide6.QtCharts.QXYSeries.isPointSelected(index)
- Parameters
index – int
- Return type
bool
Returns true if point at given index is among selected points and false otherwise.
Note
Selected points are drawn using the selected color if it was specified.
- PySide6.QtCharts.QXYSeries.lightMarker()
- Return type
Gets the image used for drawing markers on each point of the series.
The default value is QImage(), meaning no light marker will be painted.
The light markers visualize the data points of this series and as such are an alternative to setPointsVisible (true). Both features can be enabled independently from each other.
Unlike the elements of QScatterSeries the light markers are not represented by QGraphicsItem , but are just painted (no objects created). However, the mouse-event-signals of QXYSeries behave the same way, meaning that you’ll get the exact domain value of the point if you click/press/hover the light marker. You’ll still get the in between domain value if you click on the line. The light markers are above the line in terms of painting as well as events.
See also
- PySide6.QtCharts.QXYSeries.lightMarkerChanged(lightMarker)
- Parameters
lightMarker –
PySide6.QtGui.QImage
- PySide6.QtCharts.QXYSeries.markerSize()
- Return type
float
Gets the size of the marker used to render points in the series.
The default size depends on the specific QXYSeries type. QScatterSeries has a default of 15.0 QLineSeries has a default of the series pen size * 1.5
See also
setMarkerSize()markerSize
- PySide6.QtCharts.QXYSeries.markerSizeChanged(size)
- Parameters
size – float
- PySide6.QtCharts.QXYSeries.__lshift__(points)
- Parameters
points –
- Return type
- PySide6.QtCharts.QXYSeries.__lshift__(point)
- Parameters
point –
PySide6.QtCore.QPointF- Return type
- PySide6.QtCharts.QXYSeries.pen()
- Return type
Returns the pen used to draw the outline of the data points for the series.
See also
- PySide6.QtCharts.QXYSeries.penChanged(pen)
- Parameters
pen –
PySide6.QtGui.QPen
- PySide6.QtCharts.QXYSeries.pointAdded(index)
- Parameters
index – int
- PySide6.QtCharts.QXYSeries.pointConfiguration(index)
- Parameters
index – int
- Return type
Returns a map representing the configuration of a point at index.
With points configuration you can change various aspects of each point’s look.
See also
- PySide6.QtCharts.QXYSeries.pointLabelsClipping()
- Return type
bool
This property holds The clipping for data point labels..
This property is true by default. The labels on the edge of the plot area are cut when clipping is enabled.
See also
- PySide6.QtCharts.QXYSeries.pointLabelsClippingChanged(clipping)
- Parameters
clipping – bool
- PySide6.QtCharts.QXYSeries.pointLabelsColor()
- Return type
This property holds The color used for data point labels. By default, the color is the color of the brush defined in theme for labels..
See also
- PySide6.QtCharts.QXYSeries.pointLabelsColorChanged(color)
- Parameters
color –
PySide6.QtGui.QColor
- PySide6.QtCharts.QXYSeries.pointLabelsFont()
- Return type
This property holds The font used for data point labels..
See also
- PySide6.QtCharts.QXYSeries.pointLabelsFontChanged(font)
- Parameters
font –
PySide6.QtGui.QFont
- PySide6.QtCharts.QXYSeries.pointLabelsFormat()
- Return type
str
This property holds The format used for showing labels with data points..
QXYSeries supports the following format tags:
@xPoint
The x-coordinate of the data point.
@yPoint
The y-coordinate of the data point.
For example, the following usage of the format tags would produce labels that display the data point shown inside brackets separated by a comma (x, y):
series->setPointLabelsFormat("(@xPoint, @yPoint)");
By default, the labels’ format is set to @xPoint, @yPoint. The labels are shown on the plot area, and the labels on the edge of the plot area are cut. If the points are close to each other, the labels may overlap.
- PySide6.QtCharts.QXYSeries.pointLabelsFormatChanged(format)
- Parameters
format – str
- PySide6.QtCharts.QXYSeries.pointLabelsVisibilityChanged(visible)
- Parameters
visible – bool
- PySide6.QtCharts.QXYSeries.pointLabelsVisible()
- Return type
bool
This property holds The visibility of data point labels..
This property is false by default.
See also
- PySide6.QtCharts.QXYSeries.pointRemoved(index)
- Parameters
index – int
- PySide6.QtCharts.QXYSeries.pointReplaced(index)
- Parameters
index – int
- PySide6.QtCharts.QXYSeries.points()
- Return type
Returns the points in the series.
- PySide6.QtCharts.QXYSeries.pointsConfiguration()
- Return type
Returns a map with points’ indexes as keys and points’ configuration as values.
- PySide6.QtCharts.QXYSeries.pointsConfigurationChanged(configuration)
- Parameters
configuration –
- PySide6.QtCharts.QXYSeries.pointsRemoved(index, count)
- Parameters
index – int
count – int
- PySide6.QtCharts.QXYSeries.pointsReplaced()
- PySide6.QtCharts.QXYSeries.pointsVector()
- Return type
Note
This function is deprecated.
Use points() instead. Returns the points in the series.
- PySide6.QtCharts.QXYSeries.pointsVisible()
- Return type
bool
This property holds Whether the data points are visible and should be drawn..
- PySide6.QtCharts.QXYSeries.pressed(point)
- Parameters
point –
PySide6.QtCore.QPointF
- PySide6.QtCharts.QXYSeries.released(point)
- Parameters
point –
PySide6.QtCore.QPointF
- PySide6.QtCharts.QXYSeries.remove(point)
- Parameters
point –
PySide6.QtCore.QPointF
Removes the data point point from the series.
See also
- PySide6.QtCharts.QXYSeries.remove(index)
- Parameters
index – int
Removes the point at the position specified by index from the series.
See also
- PySide6.QtCharts.QXYSeries.remove(x, y)
- Parameters
x – float
y – float
Removes the point that has the coordinates x and y from the series.
See also
- PySide6.QtCharts.QXYSeries.removePoints(index, count)
- Parameters
index – int
count – int
Removes the number of points specified by count from the series starting at the position specified by index.
See also
- PySide6.QtCharts.QXYSeries.replace(points)
- Parameters
points –
Replaces the current points with the points specified by points.
Note
This is much faster than replacing data points one by one, or first clearing all data, and then appending the new data. Emits pointsReplaced() when the points have been replaced.
See also
- PySide6.QtCharts.QXYSeries.replace(oldX, oldY, newX, newY)
- Parameters
oldX – float
oldY – float
newX – float
newY – float
Replaces the point with the coordinates oldX and oldY with the point with the coordinates newX and newY. Does nothing if the old point does not exist.
See also
- PySide6.QtCharts.QXYSeries.replace(index, newX, newY)
- Parameters
index – int
newX – float
newY – float
Replaces the point at the position specified by index with the point that has the coordinates newX and newY.
See also
- PySide6.QtCharts.QXYSeries.replace(index, newPoint)
- Parameters
index – int
newPoint –
PySide6.QtCore.QPointF
Replaces the point at the position specified by index with the point specified by newPoint.
See also
- PySide6.QtCharts.QXYSeries.replace(oldPoint, newPoint)
- Parameters
oldPoint –
PySide6.QtCore.QPointFnewPoint –
PySide6.QtCore.QPointF
Replaces the point specified by oldPoint with the one specified by newPoint.
See also
- PySide6.QtCharts.QXYSeries.replaceNp(x, y)
- Parameters
x –
PyArrayObjecty –
PyArrayObject
Replaces the current points with the points specified by two one-dimensional, equally sized numpy arrays representing the x, y values, respectively.
- PySide6.QtCharts.QXYSeries.selectAllPoints()
Marks all points in the series as selected,
- PySide6.QtCharts.QXYSeries.selectPoint(index)
- Parameters
index – int
Marks point at index as selected.
- PySide6.QtCharts.QXYSeries.selectPoints(indexes)
- Parameters
indexes –
Marks multiple points passed in a indexes list as selected.
- PySide6.QtCharts.QXYSeries.selectedColor()
- Return type
- PySide6.QtCharts.QXYSeries.selectedColorChanged(color)
- Parameters
color –
PySide6.QtGui.QColor
- PySide6.QtCharts.QXYSeries.selectedLightMarker()
- Return type
Returns the image used for drawing markers on selected series’ points.
The default value is QImage(), meaning usual lightMarker() will be painted.
This is equivalent to selectedColor if you prefer light markers over normal points, but still want to distinguish selected points.
- PySide6.QtCharts.QXYSeries.selectedLightMarkerChanged(selectedLightMarker)
- Parameters
selectedLightMarker –
PySide6.QtGui.QImage
- PySide6.QtCharts.QXYSeries.selectedPoints()
- Return type
Returns a list of points indexes marked as selected. Selected points are visible regardless of points visibility.
See also
- PySide6.QtCharts.QXYSeries.selectedPointsChanged()
- PySide6.QtCharts.QXYSeries.setBestFitLineColor(color)
- Parameters
color –
PySide6.QtGui.QColor
This property holds The color of best fit line..
See also
- PySide6.QtCharts.QXYSeries.setBestFitLinePen(pen)
- Parameters
pen –
PySide6.QtGui.QPen
- PySide6.QtCharts.QXYSeries.setBestFitLineVisible([visible=true])
- Parameters
visible – bool
This property holds The visibility of the best fit line..
This property is false by default.
See also
- PySide6.QtCharts.QXYSeries.setBrush(brush)
- Parameters
brush –
PySide6.QtGui.QBrush
Sets the brush used for drawing points on the chart to brush. If the brush is not defined, the brush from the chart theme setting is used.
See also
- PySide6.QtCharts.QXYSeries.setColor(color)
- Parameters
color –
PySide6.QtGui.QColor
This property holds The color of the series..
This is the line (pen) color in case of QLineSeries or QSplineSeries and the fill (brush) color in case of QScatterSeries or QAreaSeries .
- PySide6.QtCharts.QXYSeries.setLightMarker(lightMarker)
- Parameters
lightMarker –
PySide6.QtGui.QImage
Sets the image used for drawing markers on each point of the series as the value of lightMarker.
The default value is a default-QImage() ( isNull() == true), meaning no light marker will be painted. You can reset back to default (disabled) by calling this function with a null QImage (QImage()).
The light markers visualize the data points of this series and as such are an alternative to setPointsVisible(true). If a light marker is set with this method, visible points as set with setPointsVisible(true) are not displayed.
Unlike the elements of QScatterSeries the light markers are not represented by QGraphicsItem , but are just painted (no objects created). However, the mouse-event-signals of QXYSeries behave the same way, meaning that you’ll get the exact domain value of the point if you click/press/hover the light marker. You’ll still get the in between domain value if you click on the line. The light markers are above the line in terms of painting as well as events.
See also
- PySide6.QtCharts.QXYSeries.setMarkerSize(size)
- Parameters
size – float
Sets the size of the marker used to render points in the series.
The default size is 15.0.
See also
markerSize
- PySide6.QtCharts.QXYSeries.setPen(pen)
- Parameters
pen –
PySide6.QtGui.QPen
Sets the pen used for drawing points on the chart to pen. If the pen is not defined, the pen from the chart theme is used.
See also
- PySide6.QtCharts.QXYSeries.setPointConfiguration(index, configuration)
- Parameters
index – int
configuration –
Enables customizing the appearance of a point located at index with desired configuration.
With points configuration you can change various aspects of every point’s appearance.
A point’s configuration is represented as a hash map with pointConfiguration keys and QVariant values. For example:
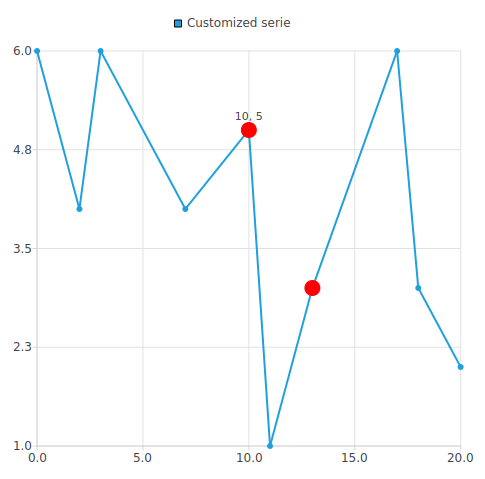
QLineSeries *series = new QLineSeries();
series->setName("Customized serie");
series->setPointsVisible(true);

*series << QPointF(0, 6) << QPointF(2, 4) << QPointF(3, 6) << QPointF(7, 4) << QPointF(10, 5)
        << QPointF(11, 1) << QPointF(13, 3) << QPointF(17, 6) << QPointF(18, 3)
        << QPointF(20, 2);

QChart *chart = new QChart();
chart->addSeries(series);
chart->createDefaultAxes();

QHash<QXYSeries::PointConfiguration, QVariant> conf;
conf[QXYSeries::PointConfiguration::Color] = QColor(Qt::red);
conf[QXYSeries::PointConfiguration::Size] = 8;
conf[QXYSeries::PointConfiguration::LabelVisibility] = true;

series->setPointConfiguration(4, conf);

conf.remove(QXYSeries::PointConfiguration::LabelVisibility);
series->setPointConfiguration(6, conf);
In this example, you can see a default QLineSeries with 10 points and with changed configuration of two points. Both changed points are red and visibly bigger than the others with a look derived from series. By default, points don’t have labels, but the point at index 4 has the label thanks to the LabelVisibility configuration value. Below is an example of a chart created in this way:
- PySide6.QtCharts.QXYSeries.setPointConfiguration(index, key, value)
- Parameters
index – int
key –
PointConfigurationvalue – object
Enables customizing a particular aspect of a point’s configuration.
Note
Points configuration concept provides a flexible way to configure various aspects of a point’s appearance. Thus, values need to have an elastic type such as QVariant . See PointConfiguration to see what value should be passed for certain key.
See also
- PySide6.QtCharts.QXYSeries.setPointLabelsClipping([enabled=true])
- Parameters
enabled – bool
This property holds The clipping for data point labels..
This property is true by default. The labels on the edge of the plot area are cut when clipping is enabled.
See also
- PySide6.QtCharts.QXYSeries.setPointLabelsColor(color)
- Parameters
color –
PySide6.QtGui.QColor
This property holds The color used for data point labels. By default, the color is the color of the brush defined in theme for labels..
See also
- PySide6.QtCharts.QXYSeries.setPointLabelsFont(font)
- Parameters
font –
PySide6.QtGui.QFont
This property holds The font used for data point labels..
See also
- PySide6.QtCharts.QXYSeries.setPointLabelsFormat(format)
- Parameters
format – str
This property holds The format used for showing labels with data points..
QXYSeries supports the following format tags:
@xPoint
The x-coordinate of the data point.
@yPoint
The y-coordinate of the data point.
For example, the following usage of the format tags would produce labels that display the data point shown inside brackets separated by a comma (x, y):
series->setPointLabelsFormat("(@xPoint, @yPoint)");
By default, the labels’ format is set to @xPoint, @yPoint. The labels are shown on the plot area, and the labels on the edge of the plot area are cut. If the points are close to each other, the labels may overlap.
- PySide6.QtCharts.QXYSeries.setPointLabelsVisible([visible=true])
- Parameters
visible – bool
This property holds The visibility of data point labels..
This property is false by default.
See also
- PySide6.QtCharts.QXYSeries.setPointSelected(index, selected)
- Parameters
index – int
selected – bool
Marks point at given index as either selected or deselected as specified by selected.
Note
Selected points are drawn using the selected color if it was specified. Emits QXYSeries::selectedPointsChanged
See also
- PySide6.QtCharts.QXYSeries.setPointsConfiguration(pointsConfiguration)
- Parameters
pointsConfiguration –
Enables customizing the configuration of multiple points as specified by pointsConfiguration.
See also
- PySide6.QtCharts.QXYSeries.setPointsVisible([visible=true])
- Parameters
visible – bool
This property holds Whether the data points are visible and should be drawn..
- PySide6.QtCharts.QXYSeries.setSelectedColor(color)
- Parameters
color –
PySide6.QtGui.QColor
This property holds The color of the selected points..
This is the fill (brush) color of points marked as selected. If not specified, value of color is used as default.
See also
- PySide6.QtCharts.QXYSeries.setSelectedLightMarker(selectedLightMarker)
- Parameters
selectedLightMarker –
PySide6.QtGui.QImage
Sets the image used for drawing markers on selected series’s points to selectedLightMarker.
The default value is QImage(), meaning usual lightMarker() will be painted.
This is an equivalent for selectedColor if you prefer light markers over normal points, but still want to distinguish selected points.
- PySide6.QtCharts.QXYSeries.sizeBy(sourceData, minSize, maxSize)
- Parameters
sourceData –
minSize – float
maxSize – float
Sets the points’ sizes according to a passed list of values. Values from sourceData are sorted and mapped to a point size which is between minSize and maxSize.
Note
If sourceData length is smaller than number of points in the series, then size of the points at the end of the series will stay the same.
- PySide6.QtCharts.QXYSeries.toggleSelection(indexes)
- Parameters
indexes –
Changes selection state of points at given indexes to the opposite one. Makes
© 2022 The Qt Company Ltd. Documentation contributions included herein are the copyrights of their respective owners. The documentation provided herein is licensed under the terms of the GNU Free Documentation License version 1.3 as published by the Free Software Foundation. Qt and respective logos are trademarks of The Qt Company Ltd. in Finland and/or other countries worldwide. All other trademarks are property of their respective owners.