Working with CoverageBrowser
Filtering with wildcards or regular expressions
CoverageBrowser provides a generic filtering mechanism of rows using wildcard or regular expressions. Wildcard expressions are activated by default whereas regular expressions are selected when the expression starts with an equals sign (=). Clicking the filter icon converts the expression from wildcard into regular form as far as this is possible and vice versa.
| Icon | Description |
|---|---|
 | The filter uses regular expression syntax. |
 | The filter uses wildcard syntax. |
 | Syntax error. More information is displayed in the status bar. |
Wildcard expressions
| Element | Meaning |
|---|---|
* | any characters (0 or more) |
? | any character |
[...] | set of character |
For example, foo*bar matches any tests containing the string foo followed by bar.
Regular expression
The first character must be = to activate the regular expressions.
Pattern matching
| Element | Meaning |
|---|---|
c | Any character represents itself unless it has a special regexp meaning. Thus c matches the character c. |
\c | A character that follows a backslash matches the character itself except where mentioned below. For example, to match, a literal caret at the beginning of a string, write \^. |
\a | Matches the ASCII bell character (BEL, 0x07). |
\f | Matches the ASCII form feed character (FF, 0x0C). |
\n | Matches the ASCII line feed character (LF, 0x0A, Unix newline). |
\r | Matches the ASCII carriage return character (CR, 0x0D). |
\t | Matches the ASCII horizontal tab character (HT, 0x09). |
\v | Matches the ASCII vertical tab character (VT, 0x0B). |
\xhhhh | Matches the Unicode character corresponding to the hexadecimal number hhhh (between 0x0000 and 0xFFFF). |
\0ooo (i.e., zero ooo) | Matches the ASCII/Latin1 character corresponding to the octal number ooo (between 0 and 0377). |
. (dot) | Matches any character (including newline). |
\d | Matches a digit. |
\D | Matches a non-digit. |
\s | Matches a whitespace. |
\S | Matches a non-whitespace. |
\w | Matches a word character. |
\W | Matches a non-word character. |
^ | The caret negates the set character if it occurs as the first character, that is, immediately after the opening square bracket. For example, [abc] matches a or b or c, but [^abc] matches anything except a or b or c. |
- | The dash is used to indicate a range of characters, for example [W-Z] matches W or X or Y or Z. |
E? | Matches zero or one occurrence of E. This quantifier means the previous expression is optional since it will match whether or not the expression occurs in the string. It is the same as E{0,1}. For example, dents? will match dent and dents. |
E+ | Matches one or more occurrences of E. This is the same as E{1,}. For example, 0+ will match 0, 00, 000, and so on. |
E* | Matches zero or more occurrences of E. This is the same as E{0,}. The * quantifier is often used by mistake. Since it matches zero or more occurrences, it will match no occurrences at all. For example, trying to match strings that end in whitespace using the regexp \s*$ would give us a match on every string. The expression finds zero or more whitespace followed by the end of the string, so even strings that do not end in a whitespace will match. The regexp we want in this case is \s+$ to match strings that have at least one whitespace at the end. |
E{n} | Matches exactly n occurrences of the expression. This is the same as repeating the expression n times. For example, x{5} is the same as xxxxx. It is also the same as E{n,n}, e.g. x{5,5}. |
E{n,} | Matches at least n occurrences of the expression. |
E{,m} | Matches at most m occurrences of the expression. This is the same as E{0,m}. |
E{n,m} | Matches at least n occurrences of the expression and at most m occurrences of the expression. |
() | Groups expressions into sub-expressions. |
| | Alternative. For example, aaa|bbb matches the string aaa or bbb. |
String substitution
| Element | Meaning |
|---|---|
& | Matched expression |
\n | Sub-expression number n. For example, the regular expression (.*):([0-9]*) matches the string joe:18. The replacement string \1 is \2 will produce the result: joe is 18. |
Code/test coverage level
The menu entry Instrumentation > Level:x sets the targeted code coverage count or, if compiled with instrumentation hit support, the targeted test coverage count.
The level determines the number of executions/test coverage runs necessary to consider that an instrumented code is executed. For example, setting the level to 10 will make it necessary to execute 10 times each line of the source code if compiled with code coverage count. If compiled with code coverage hit, 10 execution runs need to execute each line of the source code.
The menu entry Tools > Test Coverage Count Mode and the button  switch between code coverage count and test coverage count analysis. This provides the behavior of code coverage hit analysis when the project is compiled with code coverage count support.
Note: To compile with code coverage count support, use the CoverageScanner command line option --cs-count. To compile with instrumentation hit support, use --cs-hit.
Code coverage algorithm
CoverageBrowser displays the code coverage analysis (statement block, decision or condition) generated by CoverageScanner. But Instrumentation > Coverage Method > Statement Block lets you reduce the analysis to the code coverage of statement blocks. This produces the same result as compiling with the --cs-statement-block option of CoverageScanner. Similarly, Instrumentation > Coverage Method > Decision shows the code coverage analysis at the decision level.
The following table summarizes the command line options necessary for each code coverage analysis method:
| Coverage analysis | CoverageScanner command line option |
|---|---|
| Statement block | --cs-statement-block |
| Decision with full instrumentation | --cs-decision |
| Decision with partial instrumentation | --cs-decision --cs-partial-instrumentation |
| Condition with full instrumentation | Default |
| Condition with partial instrumentation | --cs-partial-instrumentation |
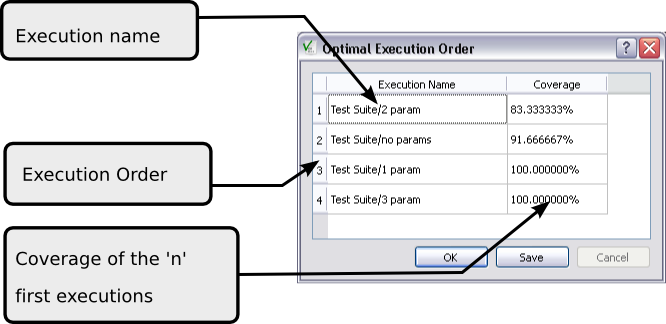
Optimized execution order
CoverageBrowser can calculate an execution order for tests with which highest code coverage can be reached with a smallest number of tests.
In this execution order, the test with the highest coverage comes first. The second test is the that one which makes the additional code coverage as high as possible, and so on.
This feature is meant for cases where the full test suite cannot be executed, e.g. because there is not enough time or there are many manual tests. It enables you to run a number of tests from the beginning of the list, say the first 20, and still get a high coverage fast.
To calculate the execution order proceed as follows:
- Select a set of executions in the Executions window.
- Click View > Optimized Execution Order. The Optimized Execution Order window opens:
- Click the Compute button to start the analysis.
Bug location
To locate a bug, CoverageBrowser simulates the behavior of a human programmer searching for a single error in the source code. It simplifies the programmer's behavior to a stochastic process that goes from source code line to source code line. After each step, the process tries to jump to the next better error candidate. After an infinite time, we can then look on the probability that a source code line was chosen as the best location of the failure.
Instructions in a program have a strong dependence, and therefore CoverageBrowser groups instructions that are always executed together because they cannot be distinguished from code coverage data. The bug location algorithm works with these groups of instructions rather than with individual statements.
At the beginning of the process, a covered source code line is selected at random. Next, we select another instrumented source code line according to the following rules:
- Select a test which covers the current line.
- Then select the next source line as follows:
- If the test passed, the line that caused the failure is not expected to be among the source lines executed by the selected test. Therefore, select any instrumented line that is not executed by this test.
- If the test failed, select any source code line that is executed by this test.
We repeat this process until a set of pertinent source code lines are identified.
Bug location example
We will use a trivial example to illustrate how the algorithm works. The following function computes the inverse of a number:
float inv( float x )
{
    if ( x != 0 )
        x = 1 * x ; // <- here is the bug
    else
        x = 0;
    return x;
}
The bug itself is easy to understand; a multiplication is used instead of a division.
Our test suite is:
| Name | Test | State |
|---|---|---|
| INV(0) | inv(0) == 0 | Passed |
| INV(1) | inv(1) == 1 | Passed |
| INV(2) | inv(2) == 0.5 | Failed |
| INV(3) | inv(3) == 0.3333333 | Failed |
| INV(4) | inv(4) == 0.25 | Failed |
We will now simulate the bug location algorithm step by step.
Note: The following is a simplified version of the algorithm that Coco uses. It would return the same results as the actual algorithm, but be too slow in practice. For better precision and better performance, CoverageBrowser computes the probabilities directly and does not use a sampling method as below.
First we note that it is not possible to distinguish between the lines if ( x != 0 ) and return x; with a test. If one of these lines is executed, the other one is also. We group them together and view them as a single line. This means that if we estimate that these lines are a good error candidate, we cannot determine which line contains the bug. To simplify the explanation, we omit the return; statement.
The algorithm starts by randomly selecting a source code line as an error candidate. We use the line if ( x != 0 ) as our starting point. The algorithm then searches the list of the tests that execute this line and chooses one at random. Let's assume that it selects INV(2):
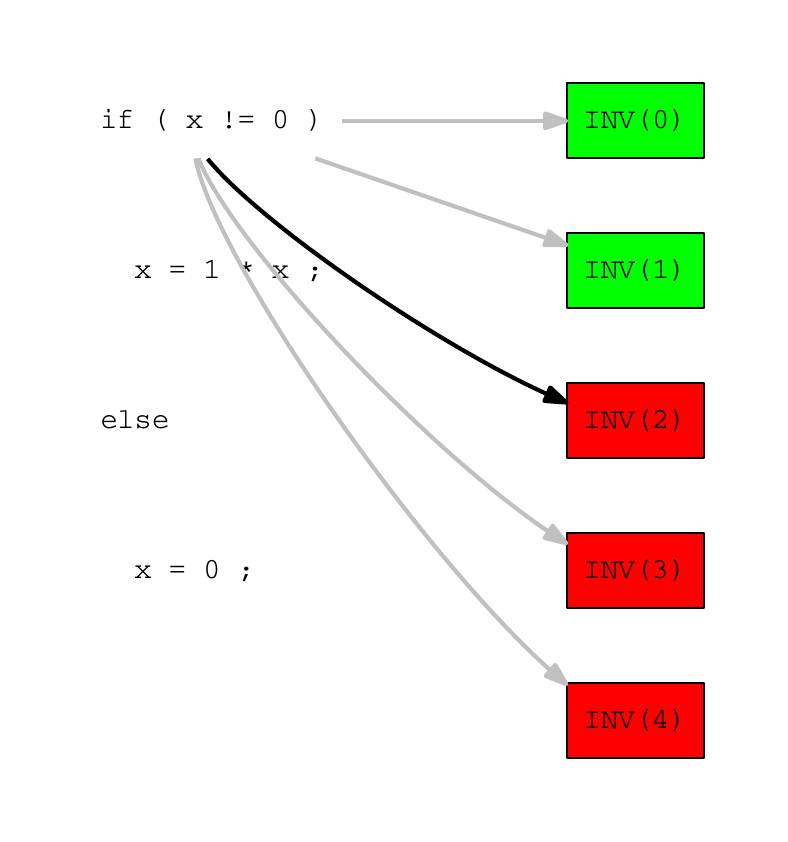
Bug location of INV example – Step 1
The test INV(2) has failed, and we assume that one of the source code lines executed by this test is responsible for the error. The algorithm then selects as error candidate another line that is executed by INV(2). We assume it is x = 1 * x:
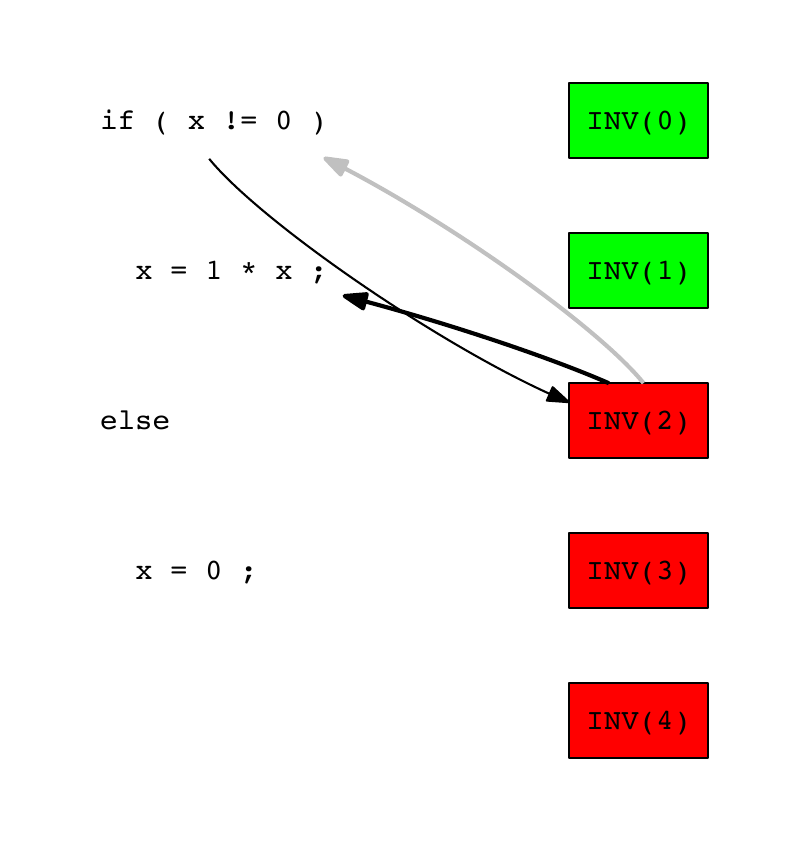
Bug location of INV example – Step 2
The algorithm then selects randomly the test INV(1) in the set of tests executed by the line x = 1 * x (INV(1), INV(2), INV(3) and INV(4)):
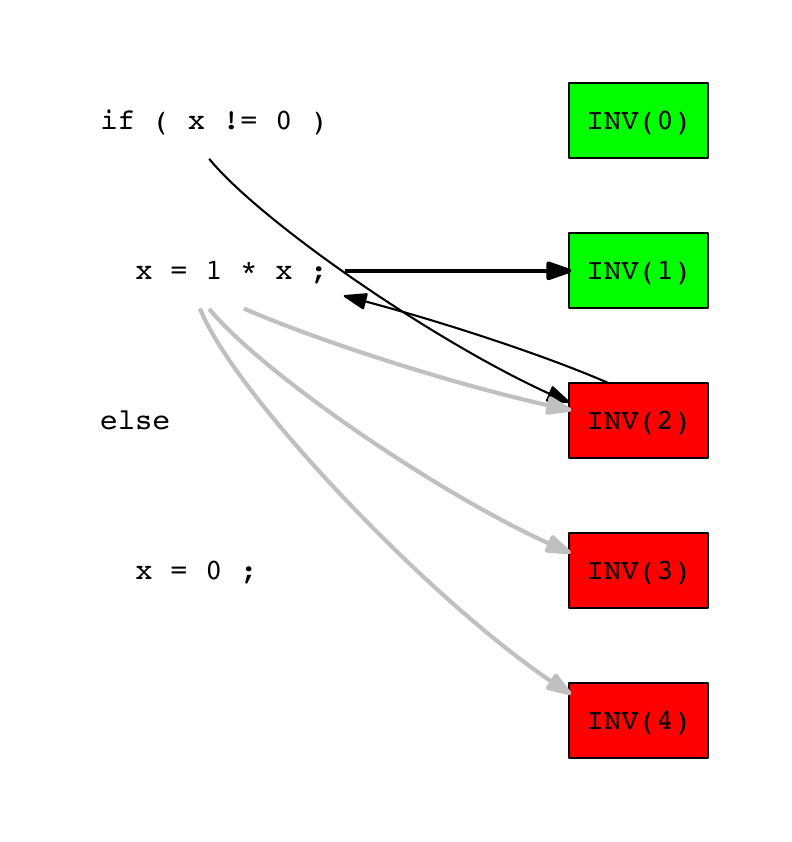
Bug location of INV example – Step 3
The test INV(1) was passed, so we assume that a source code line which is not executed by this test is responsible of the error. We select x = 0; as the next candidate:
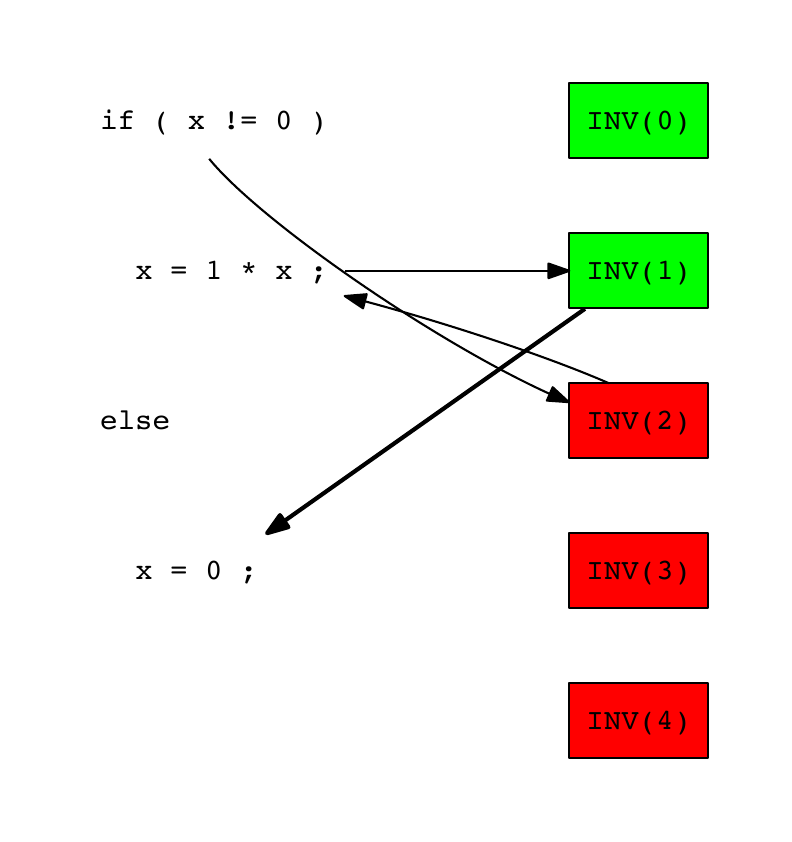
Bug location of INV example – Step 4
We iterate this process infinitely and compute the probabilities that a source line is chosen as error candidate:
| Line | Probability |
|---|---|
x = 1 * x | 0.528 |
if ( x != 0 ) | 0.283 |
x = 0; | 0.188 |
As expected, the line x = 1 * x has the highest probability of having a bug.
Usage
To calculate the bug location:
- Select a set of executions in the Executions window. At least one execution should have failed.
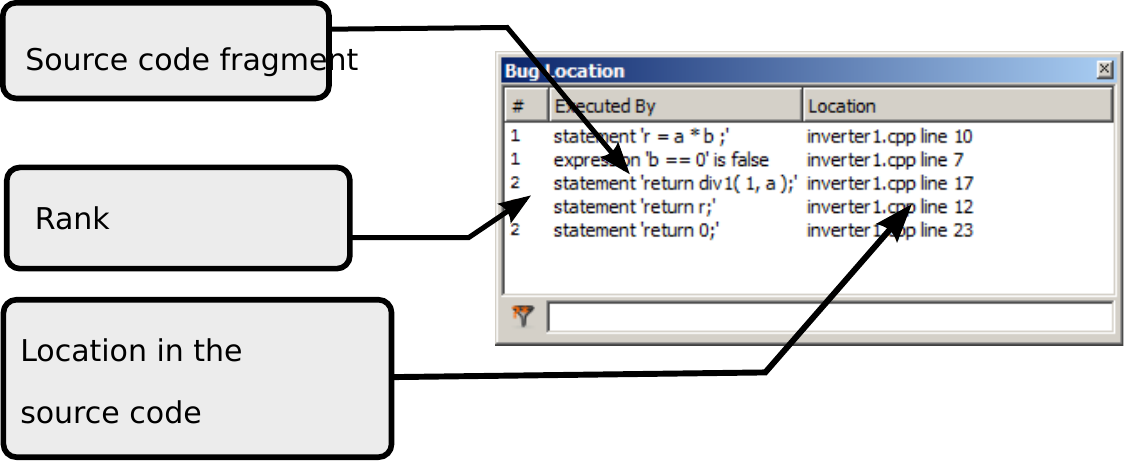
- Click View > Bug Location to open the Bug Location window:
- Click the Compute button to start the analysis.
Patch analysis
Select Tools > Patch File Analysis to generate a report about the influence of a patch on the test coverage of a project, without running the test suite for the patched version.
Prerequisites are a project for which .csmes and .csexe files exist and are loaded into CoverageBrowser, and a diff file. Patch analysis works best with programs that have automatic tests and which are instrumented in such a way that the names of the tests are known to Coco (see Test suites and Coco). Line coverage (--cs-line) and statement block coverage (--cs-statement-block) should not be disabled. They are on by default.
The diff file must be in the unified format. It is generated by the Linux™ diff utility with the option -u, and is also the default output format of several version control systems (see Generation of diff files).
Click Tools > Patch File Analysis to open the Patch File Analysis dialog that contains the following fields:
- Title: The title of the report, both for HTML and CSV.
- Patch File: Path of the patch file that contains the changes to the project.
- Output: The output file and its type:
- Type: Either HTML or the Excel CSV format.
The field to the right of the Type field contains the name and path of the report file that is generated.
- Source Code Parameter: For HTML reports, the display of the annotated source code:
- Tooltip Maximal Size: The annotated patch file in the HTML report has a tool tip which displays the tests that have executed a certain line of code. This parameter sets the maximal number of tests that can appear in a tooltip. With a value of 0, no tooltips appear.
- CSV Parameter: The format of the CSV report:
- Column Separator: The column separator symbol can be either a comma or a semicolon.
- Sections: The content of the report:
- Execution Statistics: Create a table that groups the tests by their results. It shows how many of the tests have passed, failed, need manual testing, and whose execution status is unknown.
- Executions: Create a list of the tests that execute code which is affected by the patch. For each test, the name and the execution result is shown.
- Source Code Statistics: Create a table that shows the influence of the patch on the test coverage. It shows how many lines in the patch are covered by a test, how many are not, and for how many lines Coco could not find out whether they are covered. These numbers are shown for the lines that were removed, or added, and for all lines of the patch.
- Annotated Patch Source: Create an annotated version of the patch file. Each line of code in the patch is shown in red if it is removed, green if it is added, or otherwise gray. Also shown are the line numbers of the code lines, both before and after the patch is applied, and the number of tests that cover a line. This last field also has a tooltip that shows which tests cover the specific line. The tooltip is only visible if Tooltip Maximal Size is set to a non-zero value.
To generate the report, click either OK or Show, which also opens a browser window to show the generated report. Clicking Apply saves the values of the dialog entries without generating a report, while Cancel closes the dialog without saving anything.
Comparing code coverage of two software releases
CoverageBrowser compares instrumentation databases to:
- Check whether the modified/unmodified code is correctly tested.
- Determine which tests are impacted by a source code modification.
This feature is particularly adapted to compare two releases that contain small modifications (bug fixes only) and to limit the tests of the modified code only.
In this mode, CoverageBrowser uses the typographic rules summarized by the following table. When detecting identical code parts, comments and blanks are ignored.
| Rule | Source Window | Method List | Source List | Execution List |
|---|---|---|---|---|
| Normal font | Identical source part | Identical methods | Identical files | Executions available in both releases |
| Bold | Modified methods | Modified files | ||
| Bold+Underline | New text inserted | New methods | New files | New executions |
| Bold+Strike | Deleted text | Deleted methods | Deleted files | Missing executions |
The CoverageBrowser comparison and difference algorithm is particularly designed for languages with a C-like syntax, like C, C++, C# and QML; it ignores white spaces and modifications in comments.
Reference database
The reference database is the base instrumentation database which is used for the comparison. To select it, click Tools > Compare with and select a .csmes database. To switching between the working database and the reference database, click Tools > Switch databases.
Once the reference file is loaded, additional filter possibilities are available in the Executions, Sources and Methods window. These filters let you show/hide, modified, new, deleted or identical procedures and source files.
The Executions window displays a mix between the executions of the reference and the current release:
- Stroked executions are only available in the reference release. The statistic computed corresponds to the coverage for the reference release. This value can be interpreted as an expected code coverage when these tests get re-executed on the current release.
- Underlined executions are new tests.
- Executions available in both versions are not highlighted.
Coverage analysis of modified/unmodified source code
CoverageBrowser is able to limit the code coverage analysis to the modified (resp. unmodified) functions. When selecting the coverage analysis on the modified (resp. unmodified) functions only, CoverageBrowser treats all unmodified (resp. modified) functions as if they were not instrumented. Limiting the code coverage analysis to modified functions can be a practical way to verify that the new features are tested and to identify the list of tests which are affected by a modification. To limit the code coverage to modified functions (resp. unmodified functions) click Tools > Analysis of Modified Functions (resp. Tools > Analysis of Identical Functions).
Changing the instrumentation database
Merging instrumentations
Click File > Merge with to import the executions, source code, and instrumentations from other .csmes files. Comments and code marked as validated are merged together.
Importing unit tests
Click File > Import Unit Tests to import the execution report of unit tests into the current application. Only execution reports of source files present in the main application are imported. Executions of other source files (for example test code) are ignored.
Importing reviewer comments
Click File > Import Reviewer Comments to import comments and manual validations of a previous version of the current instrumentation database. Comments and manual validations of unmodified functions will be imported even if the source code is modified.
Function profiler
Note: The function profiler does not work on all platforms. (See here for details).
The function profiler is activated as soon as the --cs-function-profiler=option (with the option all or skip-trivial) is added to the compiler and linker command line arguments. It shows the time spent for each function in CoverageBrowser.
Like for code coverage, the profiler lets you analyze the time consumed for each procedure of each selected group of tests. It also lets you compare the timing between two product versions or between executions.
The profiling information is displayed in the Function Profiler window:
- Total Duration: the accumulated execution time of the function.
- Count: the number of function calls.
- Mean Duration: the mean execution time of a single call.
All timing information is for the selected executions. To exclude or include tests interactively from the profiling analysis, select them in the Execution window. Clicking the title bar of a column sorts the column, making it easier to quickly find the highest values.
Note: The ticks used for the profiler are different from those used for computing the execution time of the application. The former is able to measure short durations but has not the same absolute precision. For this reason, the timing displayed may differ a bit between the profiler window and the execution window.
Comparing executions
CoverageBrowser enables comparing the profiling information between two sets of tests. The principle is simple: a set of reference functions is selected and compared with another set.
The comparison is realized by a difference and a ratio computed in an additional column:
- Difference: the difference (selected − reference) lets you compare the absolute time and counts between the two sets.
- Ratio: the ratio (selected / reference) lets you compare a relative difference between the two sets.
For all three kinds of measurements provided by the function profiler (count, duration, and mean duration) three additional columns are provided with the values of the reference set, the difference, and the ratio. Sort the columns to quickly identify the difference in terms of the used computation resources between two tests.
Comparing two software versions
Exactly like for the comparisons of the executions of a binary, you can compare the executions of two different binaries. This lets you analyze the difference in performance of two software versions.
CoverageBrowser provides the same computation as for the execution comparison in the Profiler window. It also provides some additional columns, which enables seeing the functions that are differently instrumented from one version to another.
Coco v7.5.1 ©2026 The Qt Company Ltd.
Qt and respective logos are trademarks of The Qt Company Ltd. in Finland and/or other countries worldwide. All other trademarks are property
of their respective owners.
