CoverageBrowser Windows
Executions
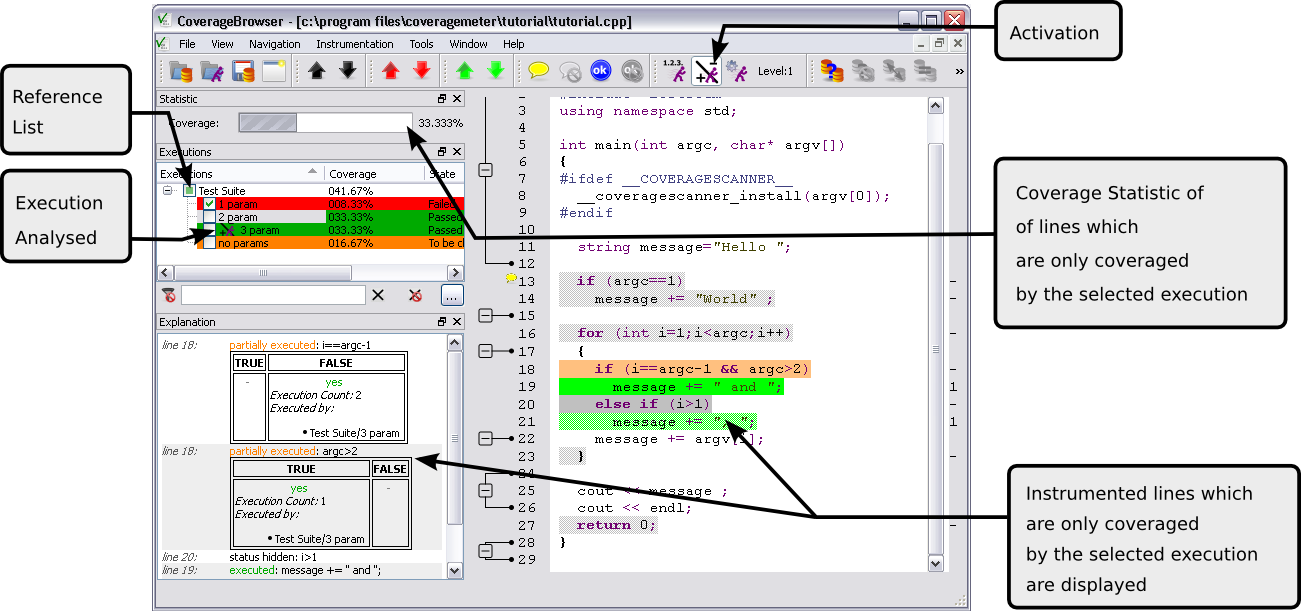
This window is present in both black box and white box testing mode. It shows all application executions that have been done, including details of their code coverage.
Principles
Executions of the instrumented application are displayed in a tree view in the Executions window. CoverageBrowser uses a slash / as a separator for grouping measurements together.
For example, the tests shown in the following image have the following names:
- Test Suite/1 param
- Test Suite/2 param
- Test Suite/3 param
- Test Suite/no params
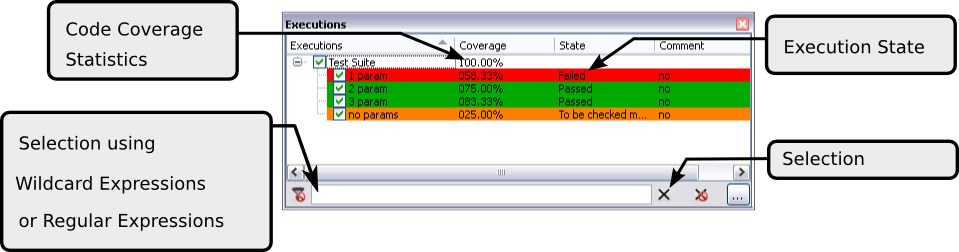
Executions window
The checkbox next to each item can be used to select executions. The Sources, Functions and Source Viewer windows only display the code coverage status of the selected executions.
The code coverage percentage of the tests is visualized by gray horizontal bars in the Coverage column.
The input field  allows filtering with wildcards or regular expressions. Click the
  button to select all the visible executions (i.e., all those that have not been filtered out). Or click the
  button to unselect all the executions.
For a more finely controlled filter, click the ... button. This will pop up a dialog where you can set filtering depending on the execution state and the comments.
Note that the text which is filtered is a test execution's full name—for example, SubTest/test1.
Click the  button to switch to the Execution Comparison Analysis Mode.
The user can set the state of the executed test by clicking the State field of a test. The new state can be any of the following:
- Unknown: Default state.
- Passed: This state is used to mark the test as passed. The background color of the State field is then green.
- Failed: This state is used to mark the test as failed. The background color of the State field is then red.
- Need manual check: This state is used to indicate that the test must be done manually. The background color of the State field is then orange.
Note: The name of the test item and its state can also be defined by an external test suite (see Test suites and Coco).
It is possible to rename, delete or merge executions, or add comments to them through the use of CoverageBrowser's context menus and dock windows. After merging, the executions used as the source of the new merged execution are deleted.
Use expressions to identify the executions to which these modifications are applied. The regular expression syntax is described in Filtering with wildcards or regular expressions. Before regular expression-driven actions are carried out, CoverageBrowser shows a preview of what effects the change would have.
To delete executions, right-click into the Executions window and select Delete multiple executions from the context menu. A window appears into which the name of the executions can be entered. Here are some examples:
- To delete all executions using the wildcard syntax:
- Execution Name:
*
- Execution Name:
- To delete all executions in
TESTSusing the wildcard syntax:- Execution Name:
TESTS/*
- Execution Name:
- To delete all executions in
TESTSusing the regular expression syntax:- Execution Name:
=TESTS/.*
- Execution Name:
To rename executions, select Rename multiple executions from the context menu. A window appears into which expressions for the old and new names of the executions can be entered.
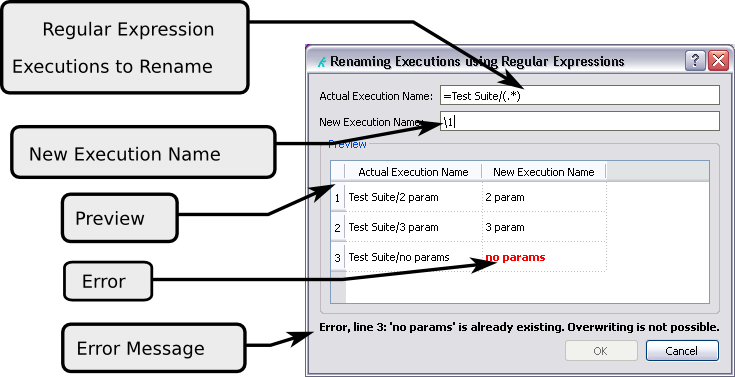
Renaming with regular expressions
Here are some examples:
- To move all executions to the directory
TESTS, set:- Actual Execution Name:
=.* - New Execution Name:
TESTS/&
- Actual Execution Name:
- To move all executions in the directory
TESTSto the directoryOLD, set:- Actual Execution Name:
=TESTS/(.*) - New Execution Name:
OLD/\1
- Actual Execution Name:
- To rename all executions in all directories to
testname [directory], set:- Actual Execution Name:
=([^/]*)/([^/]*) - New Execution Name:
\2 [\1]
- Actual Execution Name:
Loading an execution report
An execution report is produced when an instrumented application finishes its execution. It contains the list of all executed code segments for each application that was run. The execution report is never overwritten; execution data are always appended. Its file name is defined by the initialization function __coveragescanner_install() of the CoverageScanner library (see __coveragescanner_install()) and always ends with .csexe.
To load an execution report, click File > Load Execution Report or the icon  on the toolbar. The following dialog opens.
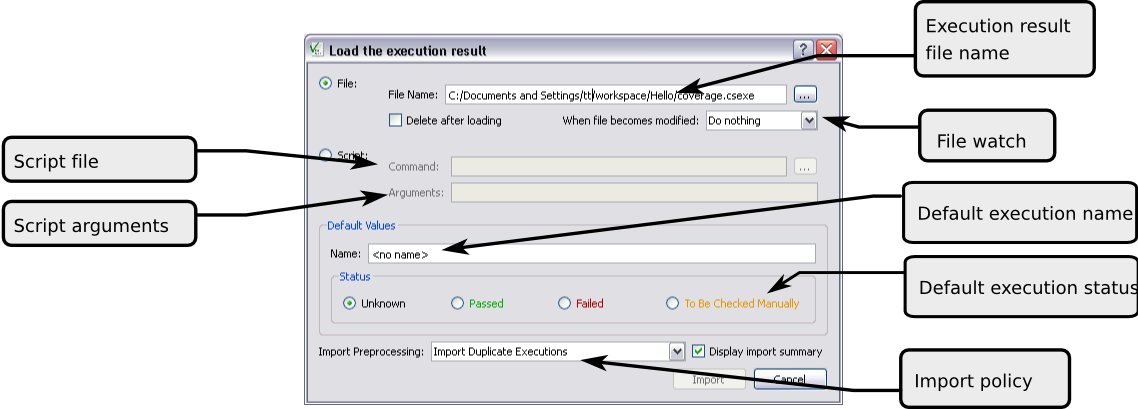
Execution report loading dialog
Import from a file
The report can be imported directly or via a script. To load it directly, select File in the top left menu. Enter the path of the .csexe file into the free form input box, or use the browse button.
The Name field specifies the name of the imported instrumentation if it is not already specified in the execution report (see __coveragescanner_testname()). It is also possible to set the status (Passed, Failed or Requires Manual Checking) of all imported executions for which it was not set at runtime. By default the status is Unknown.
Invalid executions are not imported. If more than one instrumentation is imported with the same name, an index number is appended to the name to make it unique. An execution with the name Main Test may then become Main Test (2).
To see which executions will be imported, click Next, which shows a list of all executions in the file you want to load, together with a description whether they will be imported and why.
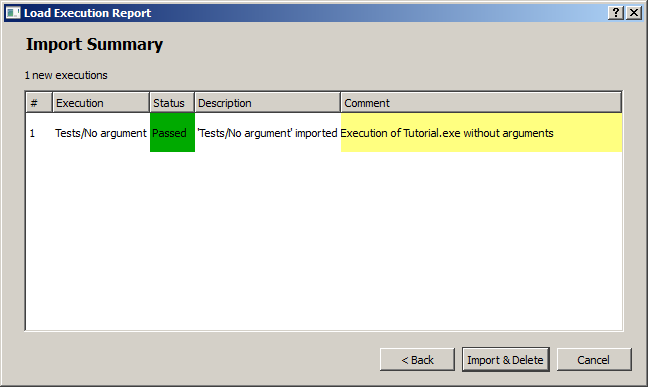
Import overview
At this point, no import yet has taken place. One still needs to press the Import (or Import & Delete) button to load the .csexe data. Or one can click Back to change the settings, or Cancel to stop it all.
Import by a script
If the execution report is not accessible through the file system, a script can be used to import it. To do this, select Script in the menu at the top left of the dialog.
Two input fields become visible:
- Fetch Command: Enter here the script that imports the execution report, together with its parameters.
The script must print the content of the execution report to the standard output (
stdout). If it writes to the standard error stream (stderr), the output occurs in a window and can be used for debugging. On success, the script must return the value 0. - Delete Command: Enter here the script that deletes the execution report, together with its parameters.
This field needs only to be filled in when the Delete execution report after loading mode is selected.
In both input fields, quotation marks (single and double quotes) can be used to group arguments, and backslashes can be used as escape characters.
Clicking the Next button executes the fetch command. If it fails, an error report is shown. If it is successful, a preliminary list of imported executions is shown as before. To finish the import, it is again necessary to click Import (or Import & Delete) button.
Additional options grouped in the advanced parameters section can also be specified:
- If the checkbox Delete execution report after loading is enabled, the execution report file will be automatically deleted after it has been loaded.
- If the checkbox Open this dialog automatically when the file is modified is selected, the import dialog reappears whenever the
.csmesfile changes, and it can be loaded again.A workflow to collect test results interactively is to have this and the previous checkbox selected and then run the instrumented program repeatedly. Each time the program ends, a
.csexefile is created and can be imported into the CoverageBrowser and then be deleted. This way the test results accumulate. - If the checkbox Check output for scripts is selected and the execution reports are loaded by scripts, an output window is shown when the script is executed. It displays the output of the script while it runs, and finally its return value.
- The option Import Preprocessing selects the behavior in case of conflicts or redundant executions:
- Ignore Duplicate Executions: Executions are ignored if they have executed the same code as an execution that was already imported.
- Import Duplicate Executions: Executions are imported if at least one instrumented source code line is executed.
- Import Duplicate and Empty Executions: All executions are imported.
- Merge executions with the same name: All executions with the same name are merged. The execution counts of all merged instrumentations are added.
The Execution Comparison Analysis Mode
The Execution Comparison Analysis mode is activated by clicking the button .
In this mode, one or more executions must be selected as references and others as those to analyze. CoverageBrowser then shows only those lines as covered that were executed in the analyzed executions but not in the reference executions. Similarly, the coverage statistics displayed in the Sources list contain only the percentage of instrumented statements that were executed only by the executions to analyze.
With Execution Comparison Analysis mode, you can find changes in the coverage between different runs of a program.
First select the reference executions by using the checkboxes in the Reference column in the Executions window. Then select the executions to analyze in the Execution column.
Note: If the execution to analyse is present in the list of reference executions, it is implicitly removed from the list. So if execution A is compared to executions A and B, CoverageBrowser actually compares execution A only with B, since comparing A with itself will provide no useful information.
Execution Comparison Analysis Mode
Sources
Note: This feature is not available for black box testing.
Open th Sources window by selecting View > Sources.
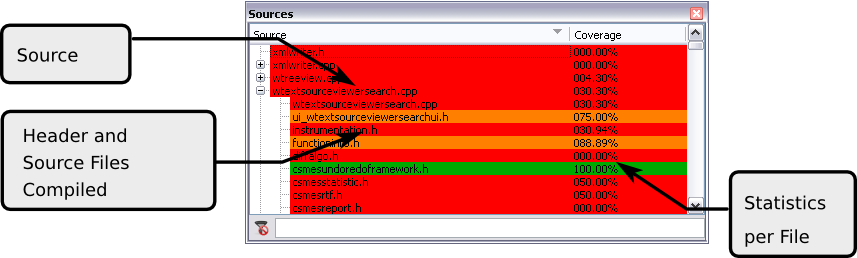
Sources window
Each line in the Source column contains the name of a source file. When you click a line, the Source Window is displayed.
For C and C++, there are sub-entries for included header files which have been instrumented.
If a file has been compiled more than once but with different preprocessor options, the file gets more than one entry. To distinguish them, the entries get numbers attached. In the example, the file context.h could then become the two entries context.h #1 and context.h #2. When coverage percentages are computed, each variant counts as a separate file.
The Coverage column displays a rudimentary code coverage statistics for each source code file. There is an underlying horizontal bar in each field whose length represents the fraction of the code that is covered. The color of the main part of the bar is selected according to code coverage statistics for each file and the value of thresholds.
If parts of the code have been manually validated, then there is a second, gray, horizontal bar to the left of the Coverage column; its width represents the number of tests that have been only manually validated. The full length of the column still represents the fraction of all tests that have been validated. When the window also contains a Manual Validations column, only the gray horizontal bar is displayed there.
The checkbox in front of each source file lets you exclude or include the source file for statistics computation. If excluded, the file is treated as if it and its functions had not been instrumented.
The input field allows filtering the content of the window with regular expressions. The filter expression refers to the full path of the source file. For example: c:\directory\file.cpp.
| Icon | Shortcut | Description |
|---|---|---|
 | Ctrl+Shift+F | Previous source file |
 | Ctrl+F | Next source file |
Functions
Note: This feature is not available for black box testing.
The Functions window can be opened by selecting the menu entry View > Functions.
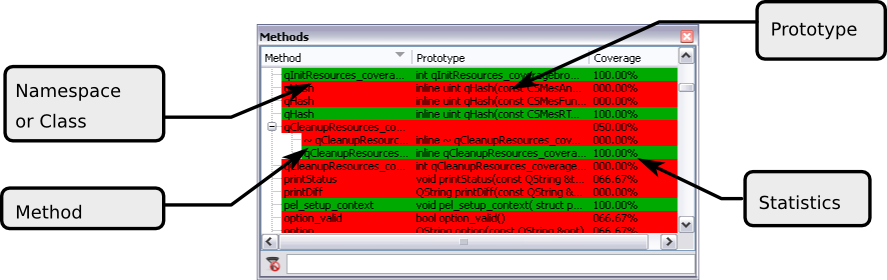
Functions window
It displays the code coverage statistics for all functions, classes and namespaces. A click an item in the window shows the code for the corresponding object in the Source Viewer window and highlights it.
The Method column contains the name of the function or class method whose coverage is shown. If hierarchical display is enabled, it also displays classes and name spaces. If a function is defined in a file that is compiled more than once and with different preprocessor options, it gets several entries. To distinguish them, the name of the file and a number is attached. A function get_context() in the file context.h could then have the two entries get_context() [error.h #1] and get_context() [error.h #2]. The names and the numbers of the files are the same as those in the Sources window.
The Coverage column displays a rudimentary code coverage statistics for each function. There is an underlying horizontal bar in each field whose length represents the fraction of the code that is covered. The color of the main part of the bar is selected according to code coverage statistics for each file and the value of thresholds.
If parts of the code have been manually validated, then there is a second, gray, horizontal bar to the left of the Coverage column. Its width represents the number of tests that have been only manually validated. The full length of the column still represents the fraction of all tests that have been validated. When the window however also contains a Manual Validations column, only the gray horizontal bar is displayed there.
The input field lets you filter the output with regular expressions. The filter expression refers to the full names of the items, including the class name and the namespace. For example: MyNamespace::MyClass::MyProc.
Source Viewer
Note: This feature is not available for black box testing.
The Source Viewer window can be displayed by clicking View > New Source Window.
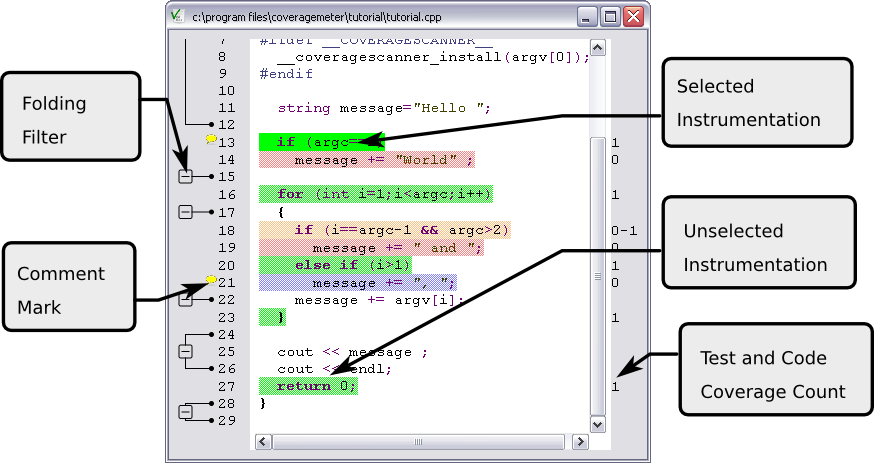
Source Viewer
The Source Viewer window displays the source file or its C or C++ preprocessed view. Clicking  enables the user to toggle between the 2 different views.
The source code is colored with code coverage instrumentations. The colors used are described in Color Convention. By selecting an area with the mouse, corresponding instrumentations are highlighted and a detailed description of them is displayed in the Explanation window. It is possible to navigate between instrumentations using the navigation buttons  and
and  .
.
Navigation buttons in yellow, blue, red and green jump to the next or previous comments, manually validated instrumentations, non-executed code parts or executed code parts. Clicking the source code selects the nearest instrumentation.
If a comment is entered for an instrumentation, the icon  is displayed in the margin.
On the right side, CoverageBrowser displays the test coverage count or the code coverage count for each line. If a source code line contains more than one instrumentation, CoverageBrowser displays the range of their counts.
The test coverage count is obtained by generating the instrumentation with CoverageScanner using the option --cs-hit.
The code coverage count is obtained by generating the instrumentation with CoverageScanner using the option --cs-count.
| Mouse Wheel | Description |
|---|---|
Wheel | Scroll up/down |
Ctrl+Wheel | Zoom in/out |
Shift+Wheel | Next/previous instrumentation |
| Icon | Shortcut | Description |
|---|---|---|
| Ctrl+Shift+R | Previous source file |
| Ctrl+R | Next source file |
| Ctrl+Shift+I | Previous instrumentation |
| Ctrl+I | Next instrumentation |
 | Ctrl+Shift+T | Previous executed instrumentation |
 | Ctrl+T | Next executed instrumentation |
 | Ctrl+Shift+U | Previous unexecuted instrumentation |
 | Ctrl+U | Next unexecuted instrumentation |
 | Ctrl+Shift+M | Previous manually validated instrumentation |
 | Ctrl+M | Next manually validated instrumentation |
 | Ctrl+Shift+B | Previous comment |
 | Ctrl+B | Next comment |
 | Ctrl+Shift+G | Previous dead code |
 | Ctrl+G | Next dead code |
 | Ctrl+J | Open a new source window |
| Ctrl+Shift+J | Switch between the preprocessor view and the original source |
| Ctrl+K | Add/Edit comments |
 | Ctrl+Shift+K | Remove comments |
 | Ctrl+D | Mark as validated |
 | Ctrl+Shift+D | Clear validation flag |
 | Ctrl+Z | Undo |
 | Ctrl+Shift+Z | Redo |
Color Convention
Instrumentations are displayed in a source window using different colors:
- Green - Executed: An instrumentation is displayed in green when the code has been executed.
- Orange - Partially Executed: An instrumentation is marked as Partially Executed when it is not completely executed. This occurs when a Boolean expression was only true or false for example. If the source code line contains more than one instrumentation, the line is marked as Partially Executed when one of its instrumentations has not been Executed. For detailed information, see the Explanation window.
- Red - Never Executed or Execution count too low: An instrumentation is displayed in red when the code is never executed or when the execution count is lower than the execution count requested.
- Magenta - Dead-Code: An instrumentation is displayed in magenta when the code cannot be executed.
- Blue - Manually Set To Be Executed: The user can mark an instrumentation as Manually Validated. This is usually to exclude dead code or code which cannot be tested for code coverage statistics. This state is only relevant if executions are in a Never Executed or Partially Executed state.
- Gray - Unknown or Hidden: Gray is used when no information about instrumentation is available. This occurs when no executions are selected or when comparing executions of tests (see The Execution Comparison Analysis Mode).
Comments
Note: This feature is not available for black box testing.
Editing comments
It is possible to add a comment by selecting an instrumentation and clicking the context menu entry Add/Set Comment, the main menu entry Instrumentation > Add/Set Comment or the icon on the toolbar.
The Comment Window appears and allows a comment to be edited. The most recently entered comments can be retrieved by clicking the Last Comments selection field. Basic text formatting is possible using the integrated toolbar buttons.
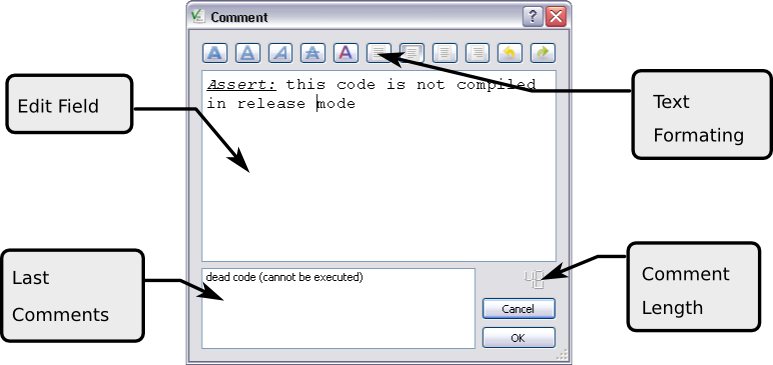
Comment Editing
Note: If a minimal length for a comment is set, the comment can only be entered if this is reached (see [minimum_comment_size]).
The comment is printed in the explanation in a yellow box and the icon is displayed in the source window near the line number.
| Icon | Shortcut} | Description |
|---|---|---|
 | Ctrl+S | Strikeout |
 | Ctrl+B | Bold |
 | Ctrl+I | Italic |
 | Ctrl+U | Underline |
 | Ctrl+J | Justify |
 | Ctrl+R | Align Right |
 | Ctrl+L | Align Left |
 | Ctrl+M | Center |
| Ctrl+Z | Undo |
| Ctrl+Shift+Z | Redo |
Removing comments
It is possible to remove a comment by selecting an instrumentation and clicking on the context menu entry Clear Comments, the main menu entry Instrumentation > Clear Comment or the icon on the toolbar.
Explanation
Note: This feature is not available for black box testing.
The Explanation window is a docking window which is automatically updated with a detailed description of the selected instrumentations of the source window. For each instrumentation, the following information is displayed:
- A short description of the instrumentation state (see Color Convention).
- The preprocessed source code which is concerned by the instrumentation.
- For Boolean expressions, the truth-table which shows executed and unexecuted states.
- The list of executions which are executing the portion of code.
- User comments.
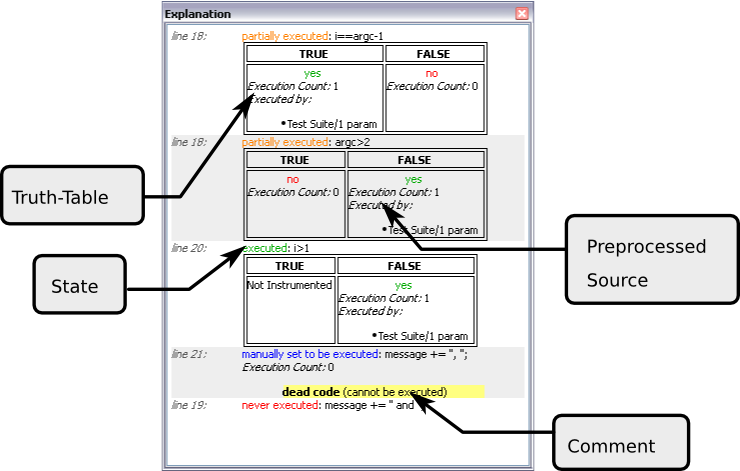
Explanation window
CoverageBrowser displays the truth-table in the case of a Boolean expression which is partially executed. The truth-table indicates which value the expression has or has not reached during execution.
For example, the truth-table indicates that the expression was false but not true.
| TRUE | FALSE |
|---|---|
| no | yes |
Statistics
The Statistics window is a docking window which is automatically updated with the code coverage statistic for the whole project.
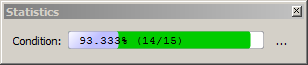
Statistics window
If parts of the code are manually validated, then their percentage is also displayed in the coverage statistics. The bar chart has two regions: the percentage of the manually validated code to the left, and then the percentage of the code that is covered by the automatic tests. The numbers in the bar chart refer to all validated code, that which was manually validated together with that covered by tests.
By clicking the ... button, the two kinds of validation are split into two separate bars.
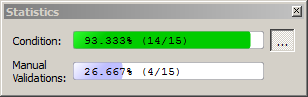
Statistics window with manual validation
Coco v7.5.1 ©2026 The Qt Company Ltd.
Qt and respective logos are trademarks of The Qt Company Ltd. in Finland and/or other countries worldwide. All other trademarks are property
of their respective owners.
