
BarSeries QML Type
일련의 데이터를 범주별로 그룹화한 세로 막대 그래프로 표시합니다. 더 보기...
| Import Statement: | import QtCharts 2.12 |
| In C++: | QBarSeries |
| Inherits: | |
| Status: | Deprecated |
이 유형은 더 이상 권장되지 않습니다. 새로운 코드에서는 이 유형을 사용하지 않는 것을 강력히 권장합니다.
상세 설명
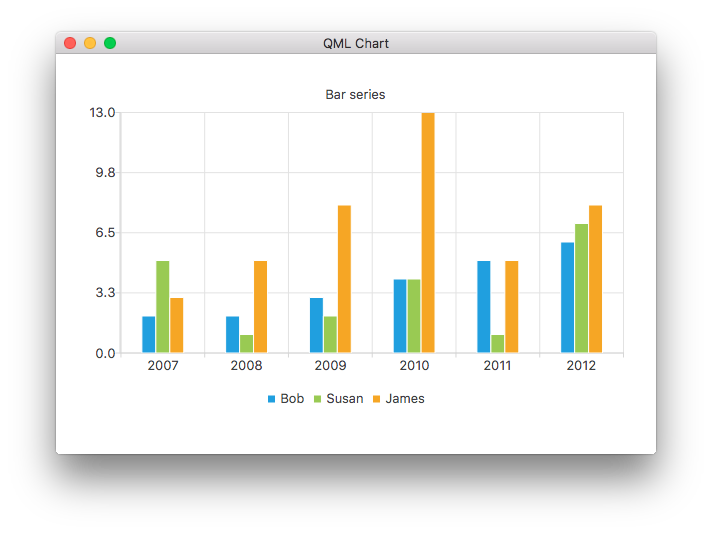
데이터는 범주별로 그룹화된 일련의 세로 막대 그래프로 그려지며, 각 막대 세트의 범주당 하나의 막대가 시리즈에 추가됩니다.
다음 QML 코드 예제는 간단한 그룹화된 막대 차트를 만드는 방법을 보여줍니다:
ChartView {
    title: "Bar Chart"
    anchors.fill: parent
    legend.alignment: Qt.AlignBottom
    antialiasing: true

    BarSeries {
        id: mySeries
        axisX: BarCategoryAxis { categories: ["2007", "2008", "2009", "2010", "2011", "2012" ] }
        BarSet { label: "Bob"; values: [2, 2, 3, 4, 5, 6] }
        BarSet { label: "Susan"; values: [5, 1, 2, 4, 1, 7] }
        BarSet { label: "James"; values: [3, 5, 8, 13, 5, 8] }
    }
}
© 2026 The Qt Company Ltd. Documentation contributions included herein are the copyrights of their respective owners. The documentation provided herein is licensed under the terms of the GNU Free Documentation License version 1.3 as published by the Free Software Foundation. Qt and respective logos are trademarks of The Qt Company Ltd. in Finland and/or other countries worldwide. All other trademarks are property of their respective owners.
