ChartView QML Type
차트의 계열, 범례 및 축의 그래픽 표현을 관리합니다. 더 보기...
| Import Statement: | import QtCharts 2.11 |
| Inherited By: |
속성
- animationDuration : int
- animationEasingCurve : easing
- animationOptions : enumeration
- axes : list<AbstractAxis>
- backgroundColor : color
- backgroundRoundness : real
- count : int
- dropShadowEnabled : bool
- legend : Legend
- locale : locale
(since QtCharts 2.0) - localizeNumbers : bool
(since QtCharts 2.0) - margins : Margins
- plotArea : rect
- plotAreaColor : color
- theme : enumeration
- title : string
- titleColor : color
- titleFont : font
신호
- seriesAdded(AbstractSeries series)
- seriesRemoved(AbstractSeries series)
방법
- Axis axisX(AbstractSeries series)
- Axis axisY(AbstractSeries series)
- AbstractSeries createSeries(enumeration type, string name, AbstractAxis axisX, AbstractAxis axisY)
- bool isZoomed()
- point mapToPosition(point value, AbstractSeries series)
- point mapToValue(point position, AbstractSeries series)
- void removeAllSeries()
- void removeSeries(AbstractSeries series)
- void scrollDown(real pixels)
- void scrollLeft(real pixels)
- void scrollRight(real pixels)
- void scrollUp(real pixels)
- AbstractSeries series(int index)
- AbstractSeries series(string name)
- void setAxisX(AbstractAxis axis, AbstractSeries series)
- void setAxisY(AbstractAxis axis, AbstractSeries series)
- void zoom(real factor)
- void zoomIn()
- void zoomIn(rect rectangle)
- void zoomOut()
- void zoomReset()
상세 설명
차트뷰 유형은 다양한 계열 유형을 차트로 표시합니다.
이 예는 간단한 꺾은선형 차트를 만드는 방법을 보여줍니다:
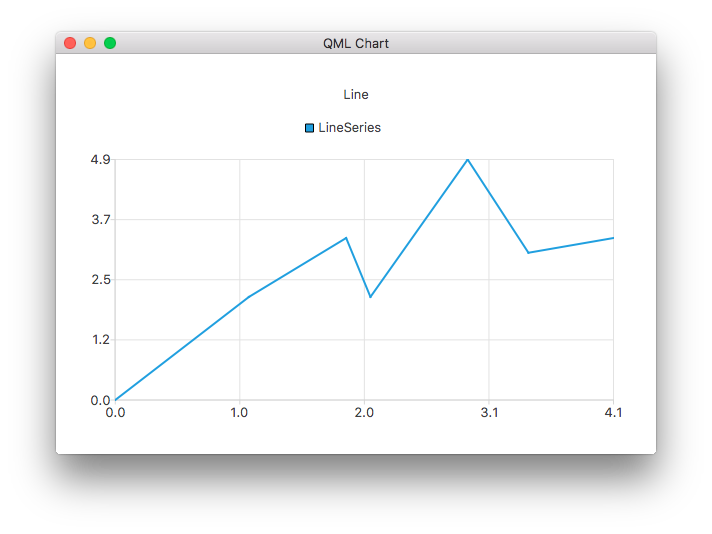
ChartView {
    title: "Line Chart"
    anchors.fill: parent
    antialiasing: true

    LineSeries {
        name: "Line"
        XYPoint { x: 0; y: 0 }
        XYPoint { x: 1.1; y: 2.1 }
        XYPoint { x: 1.9; y: 3.3 }
        XYPoint { x: 2.1; y: 2.1 }
        XYPoint { x: 2.9; y: 4.9 }
        XYPoint { x: 3.4; y: 3.0 }
        XYPoint { x: 4.1; y: 3.3 }
    }
}
속성 문서
animationDuration : int
차트의 애니메이션 지속 시간입니다.
animationEasingCurve : easing
차트에 대한 애니메이션의 완화 곡선입니다.
animationOptions : enumeration
차트에서 활성화된 애니메이션입니다:
| 상수 | 설명 |
|---|---|
ChartView.NoAnimation | 차트에서 애니메이션이 비활성화됩니다. 기본값입니다. |
ChartView.GridAxisAnimations | 차트에서 그리드 축 애니메이션이 활성화됩니다. |
ChartView.SeriesAnimations | 차트에서 시리즈 애니메이션이 활성화됩니다. |
ChartView.AllAnimations | 차트에서 모든 애니메이션 유형이 활성화됩니다. |
axes : list<AbstractAxis>
차트의 축입니다.
backgroundColor : color
차트 배경의 색상입니다. 기본적으로 배경색은 차트 테마에 의해 지정됩니다.
theme 를참조하세요 .
backgroundRoundness : real
차트 배경 모서리에 있는 반올림 원의 지름입니다.
count : int
차트에 추가된 시리즈 수입니다.
dropShadowEnabled : bool
배경 그림자 효과 활성화 여부입니다.
true 으로 설정하면 배경 그림자 효과가 활성화됩니다. false 로 설정하면 비활성화됩니다.
legend : Legend
차트의 범례입니다. 범례에는 차트에 추가된 모든 계열, 파이 슬라이스 및 막대 세트가 나열됩니다.
locale : locale [since QtCharts 2.0]
다양한 차트 레이블의 서식을 지정하는 데 사용되는 로캘입니다.
레이블은 localizeNumbers 가 true 일 때만 현지화되며, DateTimeAxis 레이블은 항상 이 속성으로 설정된 QLocale 을 사용합니다.
기본값은 차트가 생성될 당시의 애플리케이션 기본 로캘입니다.
이 속성은 QtCharts 2.0에 도입되었습니다.
localizeNumbers 를참조하십시오 .
localizeNumbers : bool [since QtCharts 2.0]
숫자 현지화 여부.
true 인 경우 다양한 계열 및 축 레이블에 표시되는 모든 생성된 숫자는 locale 속성으로 설정된 QLocale 을 사용하여 현지화됩니다. false 인 경우 항상 C 로캘이 사용됩니다. 기본값은 false 입니다.
참고: 이 속성은 항상 로캘 속성과 함께 설정된 QLocale 을 사용하는 DateTimeAxis 레이블에는 영향을 미치지 않습니다.
이 속성은 QtCharts 2.0에 도입되었습니다.
locale 를참조하십시오 .
margins : Margins
차트 사각형의 가장자리와 그림 영역 사이에 허용되는 최소 여백입니다. 여백은 제목, 축 및 범례를 그리는 데 사용됩니다.
plotArea : rect
차트가 그려지는 사각형입니다.
플롯 영역에는 여백으로 정의된 영역이 포함되지 않습니다. 기본적으로 ChartView 안에 있는 경우 크기가 조정됩니다. 플롯 영역에 명시적인 직사각형이 설정되어 있으면 이를 존중하고 기본 동작으로 되돌리려면 Qt.rect(0, 0, 0, 0) 으로 설정하면 됩니다.
margins 를참조하세요 .
plotAreaColor : color
차트 플롯 영역의 배경색입니다. 기본적으로 플롯 영역 배경은 차트 테마에서 지정한 차트의 배경색을 사용합니다.
backgroundColor 및 theme 을참조하세요 .
theme : enumeration
차트에서 사용하는 테마입니다.
테마는 색상, 펜, 브러시, 계열의 글꼴, 축, 제목, 범례 등 차트의 모든 시각적 요소에 적용되는 UI 스타일 관련 설정의 기본 제공 모음입니다. Qml 오실로스코프 예시에서는 테마를 설정하는 방법을 설명합니다.
참고: 테마를 변경하면 이전에 시리즈에 적용된 모든 사용자 지정을 덮어씁니다.
지원되는 값은 다음과 같습니다:
| 상수 | 설명 |
|---|---|
ChartView.ChartThemeLight | 기본 테마인 밝은 테마. |
ChartView.ChartThemeBlueCerulean | 청록색 테마. |
ChartView.ChartThemeDark | 어두운 테마. |
ChartView.ChartThemeBrownSand | 샌드 브라운 테마. |
ChartView.ChartThemeBlueNcs | 자연색 시스템(NCS) 파란색 테마. |
ChartView.ChartThemeHighContrast | 고대비 테마. |
ChartView.ChartThemeBlueIcy | 아이스 블루 테마. |
ChartView.ChartThemeQt | Qt 테마. |
title : string
제목은 차트 상단에 헤드라인으로 표시됩니다. 차트 제목은 HTML 서식을 지원합니다.
titleColor 을참조하세요 .
titleColor : color
제목 텍스트의 색상입니다.
titleFont : font
차트의 제목 글꼴입니다.
자세한 내용은 font 을 참조하세요.
신호 문서
seriesAdded(AbstractSeries series)
이 신호는 series 시리즈가 차트에 추가될 때 발생합니다.
참고: 해당 핸들러는 onSeriesAdded 입니다.
seriesRemoved(AbstractSeries series)
이 신호는 series 시리즈가 차트에서 제거될 때 발생합니다. 신호 처리기가 완료되면 시리즈 개체는 유효하지 않게 됩니다.
참고: 해당 핸들러는 onSeriesRemoved 입니다.
메서드 문서
Axis axisX(AbstractSeries series)
의 x축은 series.
setAxisX()도 참조하세요 .
Axis axisY(AbstractSeries series)
의 y축은 series.
setAxisY()도 참조하세요 .
AbstractSeries createSeries(enumeration type, string name, AbstractAxis axisX, AbstractAxis axisY)
이름 name 및 선택적으로 축 axisX 및 axisY 을 사용하여 차트에 type 유형의 시리즈를 추가합니다. 예를 들어
// lineSeries is a LineSeries object that has already been added to the ChartView; re-use its axes
var myAxisX = chartView.axisX(lineSeries);
var myAxisY = chartView.axisY(lineSeries);
var scatter = chartView.createSeries(ChartView.SeriesTypeScatter, "scatter series", myAxisX, myAxisY);
다음 열거형 값을 type 의 값으로 사용할 수 있습니다:
| Constant | 설명 |
|---|---|
ChartView.SeriesTypeLine | 선 시리즈. |
ChartView.SeriesTypeArea | 면적 계열입니다. |
ChartView.SeriesTypeBar | 막대 시리즈. |
ChartView.SeriesTypeStackedBar | 누적 막대 시리즈입니다. |
ChartView.SeriesTypePercentBar | 퍼센트 막대 시리즈. |
ChartView.SeriesTypeBoxPlot | 박스 플롯 시리즈. |
ChartView.SeriesTypeCandlestick | 촛대 시리즈. |
ChartView.SeriesTypePie | 파이 시리즈. |
ChartView.SeriesTypeScatter | 분산 계열. |
ChartView.SeriesTypeSpline | 스플라인 계열. |
ChartView.SeriesTypeHorizontalBar | 수평 막대 시리즈. |
ChartView.SeriesTypeHorizontalStackedBar | 수평 누적 막대 시리즈. |
ChartView.SeriesTypeHorizontalPercentBar | 가로 퍼센트 막대 시리즈. |
bool isZoomed()
시리즈에 확대된 도메인이 있는 경우 true 을 반환합니다.
point mapToPosition(point value, AbstractSeries series)
series 시리즈에서 value 값의 차트 내 위치를 반환합니다.
point mapToValue(point position, AbstractSeries series)
차트에서 position 위치에 있는 series 계열의 값을 반환합니다.
void removeAllSeries()
차트에서 모든 계열을 제거하고 모든 계열 개체를 영구적으로 삭제합니다.
void removeSeries(AbstractSeries series)
차트에서 series 시리즈를 제거하고 시리즈 개체를 영구적으로 삭제합니다.
void scrollDown(real pixels)
pixels 에서 지정한 픽셀 수만큼 아래로 스크롤합니다. 이 방법은 예를 들어 키 탐색에 적합한 편리한 방법입니다.
void scrollLeft(real pixels)
pixels 에서 지정한 픽셀 수만큼 왼쪽으로 스크롤합니다. 이 방법은 예를 들어 키 탐색에 적합한 편리한 방법입니다.
void scrollRight(real pixels)
pixels 에서 지정한 픽셀 수만큼 오른쪽으로 스크롤합니다. 이 방법은 예를 들어 키 탐색에 적합한 편리한 방법입니다.
void scrollUp(real pixels)
pixels 에서 지정한 픽셀 수만큼 위로 스크롤합니다. 이 방법은 예를 들어 키 탐색에 적합한 편리한 방법입니다.
AbstractSeries series(int index)
차트에서 index 인덱스가 있는 계열을 반환합니다. 차트의 count 속성과 함께 사용하면 차트의 계열을 반복할 수 있습니다.
count도 참조하세요 .
AbstractSeries series(string name)
차트에서 이름이 name 인 첫 번째 계열을 반환합니다. 해당 이름의 계열이 없으면 null을 반환합니다.
void setAxisX(AbstractAxis axis, AbstractSeries series)
series 의 x축을 axis 으로 설정합니다.
axisX()도 참조하세요 .
void setAxisY(AbstractAxis axis, AbstractSeries series)
series 의 y축을 axis 으로 설정합니다.
axisY()도 참조하세요 .
void zoom(real factor)
사용자 지정 계수 factor 로 차트를 확대합니다.
1.0 이상의 배율은 뷰를 확대하고 0.0에서 1.0 사이의 배율은 뷰를 축소합니다.
void zoomIn()
뷰를 두 배로 확대합니다.
void zoomIn(rect rectangle)
사각형 rectangle 이 여전히 완전히 표시되는 최대 수준까지 뷰를 확대합니다.
참고: 극좌표 차트에는 이 기능이 지원되지 않습니다.
void zoomOut()
뷰를 2배 축소합니다.
참고: 결과에 잘못된 로그 축 범위가 포함된 경우 아무 효과가 없습니다.
void zoomReset()
시리즈 도메인을 확대/축소 메서드를 호출하기 전의 상태로 초기화합니다.
참고: 첫 번째 확대/축소 작업과 이 메서드 호출 사이에 지정된 스크롤 및 명시적 축 범위 설정도 초기화됩니다. 확대/축소 작업이 수행되지 않은 경우 이 메서드는 아무 작업도 수행하지 않습니다.
© 2026 The Qt Company Ltd. Documentation contributions included herein are the copyrights of their respective owners. The documentation provided herein is licensed under the terms of the GNU Free Documentation License version 1.3 as published by the Free Software Foundation. Qt and respective logos are trademarks of The Qt Company Ltd. in Finland and/or other countries worldwide. All other trademarks are property of their respective owners.
