
SplineSeries QML Type
데이터를 스플라인 차트로 표시합니다. 더 보기...
| Import Statement: | import QtCharts 2.12 |
| In C++: | QSplineSeries |
| Inherits: | |
| Status: | Deprecated |
이 유형은 더 이상 권장되지 않습니다. 새로운 코드에서는 이 유형을 사용하지 않도록 강력히 권장합니다.
속성
상세 설명
스플라인 시리즈는 QPainterPath 가 스플라인을 그리는 데 필요한 데이터 포인트와 세그먼트 제어점을 저장합니다. 제어점은 데이터가 변경될 때 자동으로 계산됩니다. 이 알고리즘은 일반적인 스플라인을 그릴 수 있도록 제어점을 계산합니다.
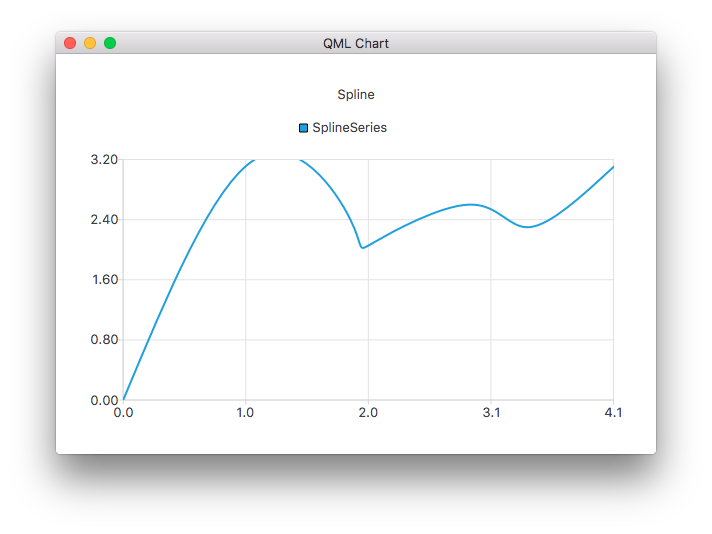
다음 QML 코드는 간단한 스플라인 차트를 만드는 방법을 보여줍니다:
ChartView {
    title: "Spline Chart"
    anchors.fill: parent
    antialiasing: true

    SplineSeries {
        name: "Spline"
        XYPoint { x: 0; y: 0.0 }
        XYPoint { x: 1.1; y: 3.2 }
        XYPoint { x: 1.9; y: 2.4 }
        XYPoint { x: 2.1; y: 2.1 }
        XYPoint { x: 2.9; y: 2.6 }
        XYPoint { x: 3.4; y: 2.3 }
        XYPoint { x: 4.1; y: 3.1 }
    }
}
속성 설명
capStyle : Qt::PenCapStyle
선의 끝단 스타일을 제어합니다. Qt.FlatCap, Qt.SquareCap 또는 Qt.RoundCap 중 하나로 설정합니다. 기본적으로 끝단 스타일은 Qt.SquareCap입니다.
Qt::PenCapStyle도 참조하십시오 .
count : int
시리즈의 데이터 점 수.
style : Qt::PenStyle
선의 스타일을 제어합니다. Qt.NoPen, Qt.SolidLine, Qt.DashLine, Qt.DotLine, Qt.DashDotLine 또는 Qt.DashDotDotLine 중 하나로 설정합니다. QML API에서는 Qt.CustomDashLine 사용이 지원되지 않습니다. 기본적으로 스타일은 Qt.SolidLine입니다.
Qt::PenStyle도 참조하십시오 .
width : real
선의 너비입니다. 기본적으로 너비는 2.0입니다.
© 2026 The Qt Company Ltd. Documentation contributions included herein are the copyrights of their respective owners. The documentation provided herein is licensed under the terms of the GNU Free Documentation License version 1.3 as published by the Free Software Foundation. Qt and respective logos are trademarks of The Qt Company Ltd. in Finland and/or other countries worldwide. All other trademarks are property of their respective owners.
