ScatterSeries QML Type
분산형 계열 유형은 데이터를 분산형 그래프로 표시합니다. 자세히...
| Import Statement: | import QtGraphs |
| In C++: | QScatterSeries |
| Inherits: |
- 상속된 멤버를 포함한 모든 멤버 목록
- ScatterSeries는 Qt Graphs 2D용 QML 유형의 일부입니다.
속성
- pointDelegate : Component
상세 설명
분산 데이터는 그래프에 점의 모음으로 표시됩니다. 각 점에 대해 가로축과 세로축에서 위치를 결정하는 두 개의 값이 지정됩니다.
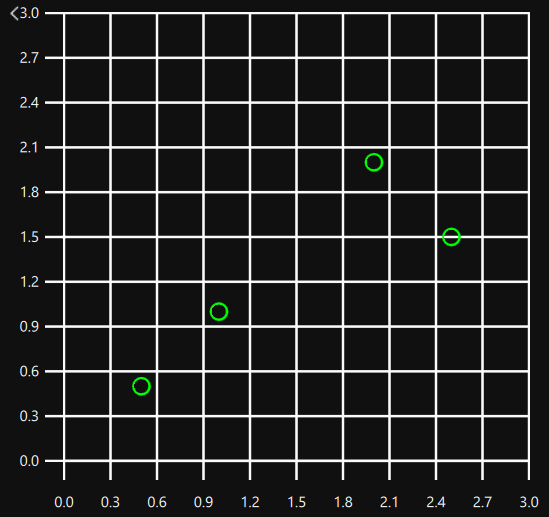
GraphsView 에서 ScatterSeries를 생성하여 분산 데이터를 표현할 수 있습니다. 각 점의 x 및 y 값을 정의하는 ScatterSeries의 하위 요소로 XYPoint를 생성하여 데이터를 그래프에 추가할 수 있습니다.
GraphsView {
    anchors.fill: parent
    axisX: ValueAxis {
        max: 3
    }
    axisY: ValueAxis {
        max: 3
    }

    ScatterSeries {
        color: "#00ff00"
        XYPoint { x: 0.5; y: 0.5 }
        XYPoint { x: 1; y: 1 }
        XYPoint { x: 2; y: 2 }
        XYPoint { x: 2.5; y: 1.5 }
    }
}
여러 개의 분산 그래프는 GraphsView 의 자식으로 여러 개의 ScatterSeries를 추가하여 만들 수 있습니다. 이러한 경우 하나의 시리즈만 여러 정의로 사용되는 축을 정의해야 앞의 정의만 재정의할 수 있습니다.
GraphsView {
    anchors.fill: parent
    ScatterSeries {
        color: "#00ff00"
        axisX: ValueAxis {
            max: 3
        }
        axisY: ValueAxis {
            max: 3
        }

        XYPoint { x: 0.5; y: 0.5 }
        XYPoint { x: 1; y: 1 }
        XYPoint { x: 2; y: 2 }
        XYPoint { x: 2.5; y: 1.5 }
    }

    ScatterSeries {
        color: "#ff0000"
        XYPoint { x: 0.5; y: 3 }
        XYPoint { x: 1; y: 2 }
        XYPoint { x: 2; y: 2.5 }
        XYPoint { x: 2.5; y: 1 }
    }
}
속성 문서
pointDelegate : Component
주어진 QML 컴포넌트로 포인트를 표시합니다.
pointDelegate: Image {
    source: "images/happy_box.png"
}
© 2026 The Qt Company Ltd. Documentation contributions included herein are the copyrights of their respective owners. The documentation provided herein is licensed under the terms of the GNU Free Documentation License version 1.3 as published by the Free Software Foundation. Qt and respective logos are trademarks of The Qt Company Ltd. in Finland and/or other countries worldwide. All other trademarks are property of their respective owners.
