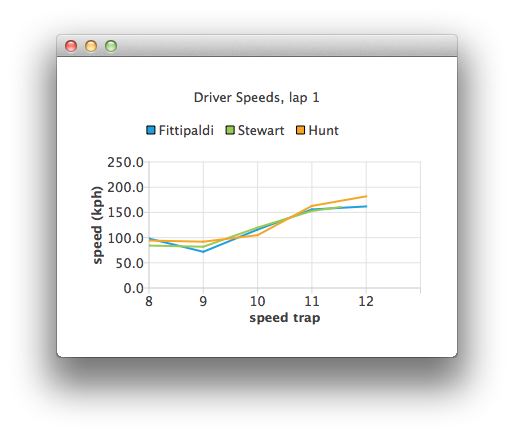
QML에서 목록 모델을 데이터 소스로 사용하기
참고: 이 예제는 QML 갤러리 차트의 일부입니다.

먼저 빈 ChartView 을 정의해 보겠습니다:
ChartView {
    id: chartView
    title: "Driver Speeds, lap 1"
    anchors.fill: parent
    legend.alignment: Qt.AlignTop
    animationOptions: ChartView.SeriesAnimations
    antialiasing: true
}
리스트 모델은 하드코딩된 테스트 데이터를 사용합니다. 실제 애플리케이션에서 데이터 소스는 타이밍 시스템이 될 것입니다.
ListModel {
    // Hard-coded test data
    ListElement { speedTrap:0; driver: "Fittipaldi"; speed:104.12 }
    ListElement { speedTrap:0; driver:"Stewart"; speed:106.12 }
    ListElement { speedTrap:0; driver:"Hunt"; speed:106.12 }
    ...
// An example ListModel containing F1 legend drivers' speeds at speed traps
SpeedsList {
    id: speedsList
    Component.onCompleted: {
        timer.start();
    }
}
데이터는 타이머로 파싱됩니다. 각 드라이버를 나타내는 라인 시리즈는 즉석에서 생성됩니다.
// A timer to mimic refreshing the data dynamically
Timer {
    id: timer
    interval: 700
    repeat: true
    triggeredOnStart: true
    running: false
    onTriggered: {
        root.currentIndex++;
        if (root.currentIndex < speedsList.count) {
            // Check if there is a series for the data already
            // (we are using driver name to identify series)
            var lineSeries = chartView.series(speedsList.get(root.currentIndex).driver);
            if (!lineSeries) {
                lineSeries = chartView.createSeries(ChartView.SeriesTypeLine,
                                                    speedsList.get(root.currentIndex).driver);
                chartView.axisY().min = 0;
                chartView.axisY().max = 250;
                chartView.axisY().tickCount = 6;
                chartView.axisY().titleText = "speed (kph)";
                chartView.axisX().titleText = "speed trap";
                chartView.axisX().labelFormat = "%.0f";
            }
            lineSeries.append(speedsList.get(root.currentIndex).speedTrap,
                              speedsList.get(root.currentIndex).speed);

            if (speedsList.get(root.currentIndex).speedTrap > 3) {
                chartView.axisX().max = Number(speedsList.get(root.currentIndex).speedTrap) + 1;
                chartView.axisX().min = chartView.axisX().max - 5;
            } else {
                chartView.axisX().max = 5;
                chartView.axisX().min = 0;
            }
            chartView.axisX().tickCount = chartView.axisX().max - chartView.axisX().min + 1;
        } else {
            // No more data, change x-axis range to show all the data
            timer.stop();
            chartView.animationOptions = ChartView.AllAnimations;
            chartView.axisX().min = 0;
            chartView.axisX().max = speedsList.get(root.currentIndex - 1).speedTrap;
        }
    }
}
© 2025 The Qt Company Ltd. Documentation contributions included herein are the copyrights of their respective owners. The documentation provided herein is licensed under the terms of the GNU Free Documentation License version 1.3 as published by the Free Software Foundation. Qt and respective logos are trademarks of The Qt Company Ltd. in Finland and/or other countries worldwide. All other trademarks are property of their respective owners.

