QML 갤러리로 차트 만들기
QML을 사용하여 다양한 차트 유형을 사용하는 방법을 보여줍니다.
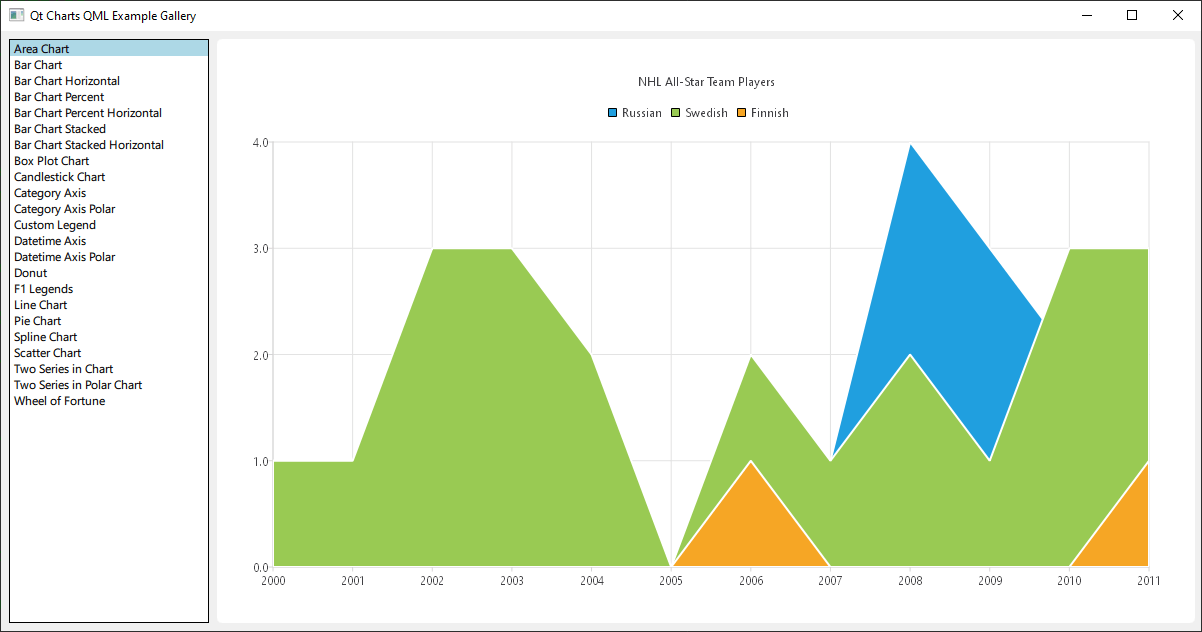
예제 실행하기
에서 예제를 실행하려면 Qt Creator에서 Welcome 모드를 열고 Examples 에서 예제를 선택합니다. 자세한 내용은 Qt Creator: 자습서를 참조하세요 : 빌드 및 실행을 참조하세요.
이 예제는 Qt Quick 애플리케이션이며, 각 차트 유형에 대한 파일은 예제 폴더의 qml 디렉터리에 있으며, 이 예제 디렉터리에 있는 ListView by main.qml에 정렬되어 로드됩니다.
이 문서는 최상위 레이아웃이나 로딩에 초점을 맞추지 않고 Qt Charts QML API의 사용에 중점을 둡니다.
종속성 포함
모든 .qml 파일은 다음과 같이 시작합니다:
import QtQuick
import QtCharts
QML로 차트 만들기
각 차트 유형을 만드는 것은 ChartView 을 만드는 것으로 시작됩니다.
파이 차트를 만들려면 PieSeries API를 몇 개의 파이 슬라이스와 함께 사용합니다:

ChartView {
    id: chart
    title: "Top-5 car brand shares in Finland"
    anchors.fill: parent
    legend.alignment: Qt.AlignBottom
    antialiasing: true

    property variant othersSlice: 0

    PieSeries {
        id: pieSeries
        PieSlice { label: "Volkswagen"; value: 13.5 }
        PieSlice { label: "Toyota"; value: 10.9 }
        PieSlice { label: "Ford"; value: 8.6 }
        PieSlice { label: "Skoda"; value: 8.2 }
        PieSlice { label: "Volvo"; value: 6.8 }
    }

    Component.onCompleted: {
        // You can also manipulate slices dynamically, like append a slice or set a slice exploded
        othersSlice = pieSeries.append("Others", 52.0);
        pieSeries.find("Volkswagen").exploded = true;
    }
}
라인 계열로 차트를 만들 수 있습니다:
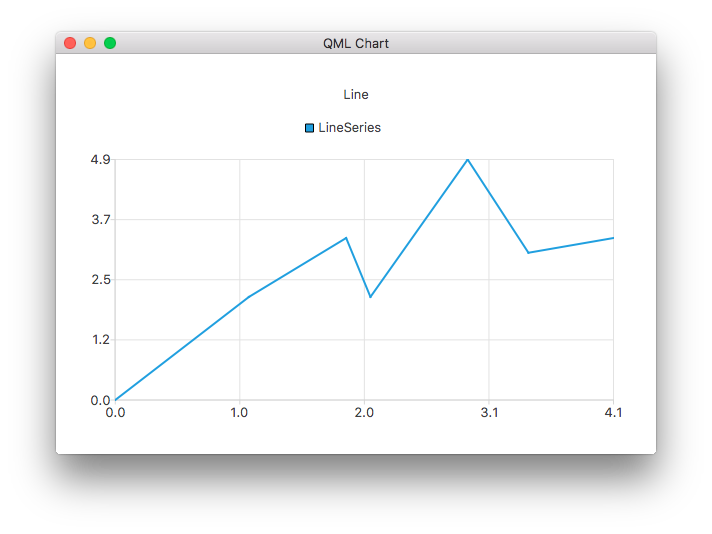
ChartView {
    title: "Line Chart"
    anchors.fill: parent
    antialiasing: true

    LineSeries {
        name: "Line"
        XYPoint { x: 0; y: 0 }
        XYPoint { x: 1.1; y: 2.1 }
        XYPoint { x: 1.9; y: 3.3 }
        XYPoint { x: 2.1; y: 2.1 }
        XYPoint { x: 2.9; y: 4.9 }
        XYPoint { x: 3.4; y: 3.0 }
        XYPoint { x: 4.1; y: 3.3 }
    }
}
그리고 스플라인 계열:
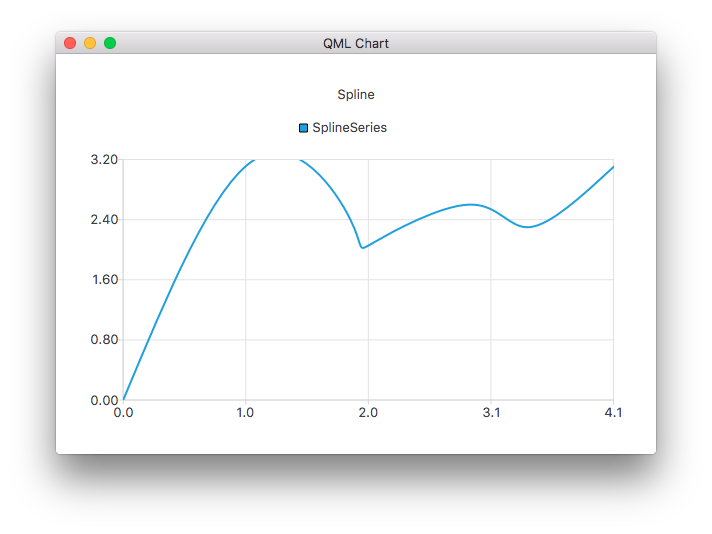
ChartView {
    title: "Spline Chart"
    anchors.fill: parent
    antialiasing: true

    SplineSeries {
        name: "Spline"
        XYPoint { x: 0; y: 0.0 }
        XYPoint { x: 1.1; y: 3.2 }
        XYPoint { x: 1.9; y: 2.4 }
        XYPoint { x: 2.1; y: 2.1 }
        XYPoint { x: 2.9; y: 2.6 }
        XYPoint { x: 3.4; y: 2.3 }
        XYPoint { x: 4.1; y: 3.1 }
    }
}
세 개의 영역 계열을 사용하여 NHL 올스타 선수 선발을 보여주는 차트를 만들 수 있습니다:
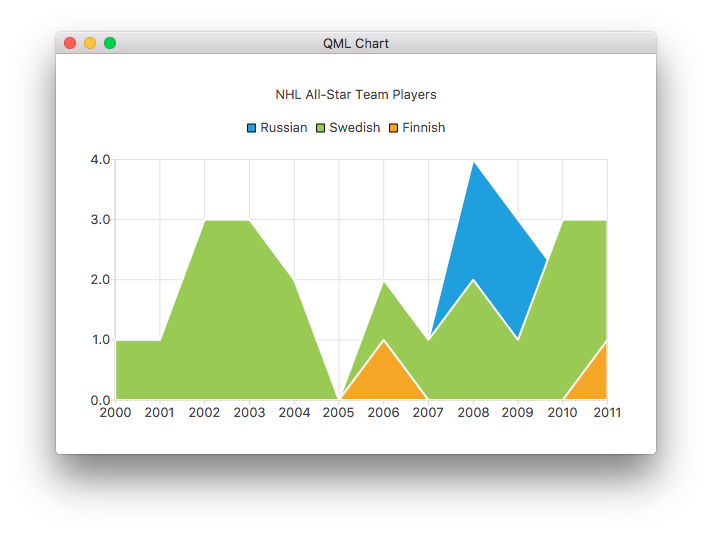
ChartView {
    title: "NHL All-Star Team Players"
    anchors.fill: parent
    antialiasing: true

    // Define x-axis to be used with the series instead of default one
    ValueAxis {
        id: valueAxis
        min: 2000
        max: 2011
        tickCount: 12
        labelFormat: "%.0f"
    }

    AreaSeries {
        name: "Russian"
        axisX: valueAxis
        upperSeries: LineSeries {
            XYPoint { x: 2000; y: 1 }
            XYPoint { x: 2001; y: 1 }
            XYPoint { x: 2002; y: 1 }
            XYPoint { x: 2003; y: 1 }
            XYPoint { x: 2004; y: 1 }
            XYPoint { x: 2005; y: 0 }
            XYPoint { x: 2006; y: 1 }
            XYPoint { x: 2007; y: 1 }
            XYPoint { x: 2008; y: 4 }
            XYPoint { x: 2009; y: 3 }
            XYPoint { x: 2010; y: 2 }
            XYPoint { x: 2011; y: 1 }
        }
    }
    ...
그리고 두 개의 분산형 계열:
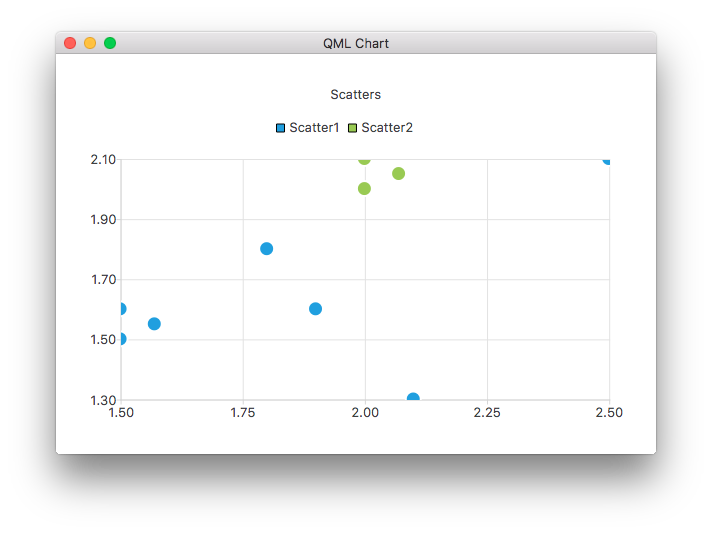
ChartView {
    title: "Scatter Chart"
    anchors.fill: parent
    antialiasing: true

    ScatterSeries {
        id: scatter1
        name: "Scatter A"
        XYPoint { x: 1.5; y: 1.5 }
        XYPoint { x: 1.5; y: 1.6 }
        XYPoint { x: 1.57; y: 1.55 }
        XYPoint { x: 1.8; y: 1.8 }
        XYPoint { x: 1.9; y: 1.6 }
        XYPoint { x: 2.1; y: 1.3 }
        XYPoint { x: 2.5; y: 2.1 }
    }

    ScatterSeries {
        name: "Scatter B"
        XYPoint { x: 2.0; y: 2.0 }
        XYPoint { x: 2.0; y: 2.1 }
        XYPoint { x: 2.07; y: 2.05 }
        XYPoint { x: 2.2; y: 2.9 }
        XYPoint { x: 2.4; y: 2.7 }
        XYPoint { x: 2.67; y: 2.65 }
    }
}
    ...
그리고 몇 가지 다른 막대 계열을 사용합니다:
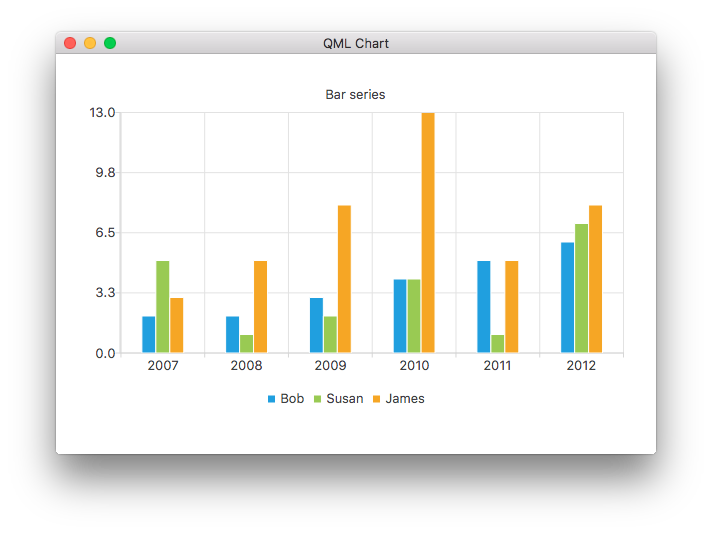
ChartView {
    title: "Bar Chart"
    anchors.fill: parent
    legend.alignment: Qt.AlignBottom
    antialiasing: true

    BarSeries {
        id: mySeries
        axisX: BarCategoryAxis { categories: ["2007", "2008", "2009", "2010", "2011", "2012" ] }
        BarSet { label: "Bob"; values: [2, 2, 3, 4, 5, 6] }
        BarSet { label: "Susan"; values: [5, 1, 2, 4, 1, 7] }
        BarSet { label: "James"; values: [3, 5, 8, 13, 5, 8] }
    }
}
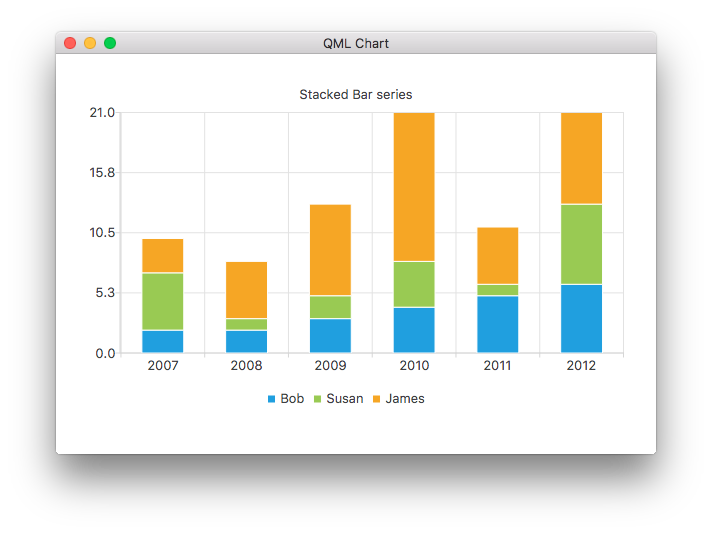
ChartView {
    title: "Stacked Bar Chart"
    anchors.fill: parent
    legend.alignment: Qt.AlignBottom
    antialiasing: true

    StackedBarSeries {
        axisX: BarCategoryAxis { categories: ["2007", "2008", "2009", "2010", "2011", "2012" ] }
        BarSet { label: "Bob"; values: [2, 2, 3, 4, 5, 6] }
        BarSet { label: "Susan"; values: [5, 1, 2, 4, 1, 7] }
        BarSet { label: "James"; values: [3, 5, 8, 13, 5, 8] }
    }
}
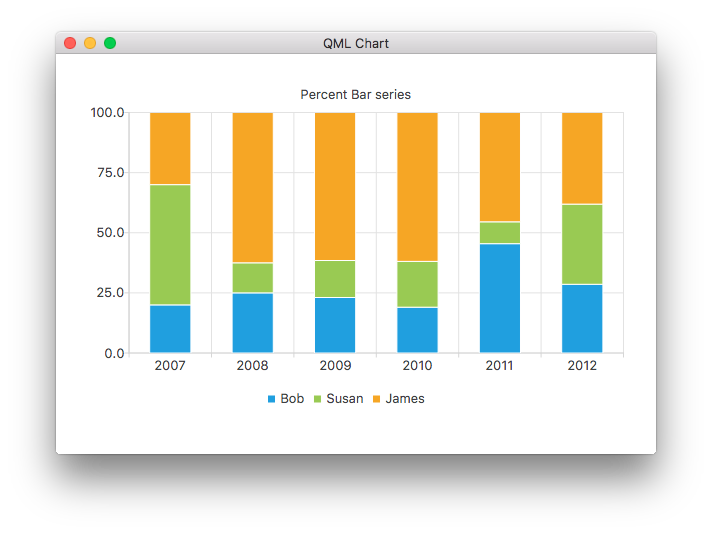
ChartView {
    title: "Percent Bar Chart"
    anchors.fill: parent
    legend.alignment: Qt.AlignBottom
    antialiasing: true

    PercentBarSeries {
        axisX: BarCategoryAxis { categories: ["2007", "2008", "2009", "2010", "2011", "2012" ] }
        BarSet { label: "Bob"; values: [2, 2, 3, 4, 5, 6] }
        BarSet { label: "Susan"; values: [5, 1, 2, 4, 1, 7] }
        BarSet { label: "James"; values: [3, 5, 8, 13, 5, 8] }
    }
}
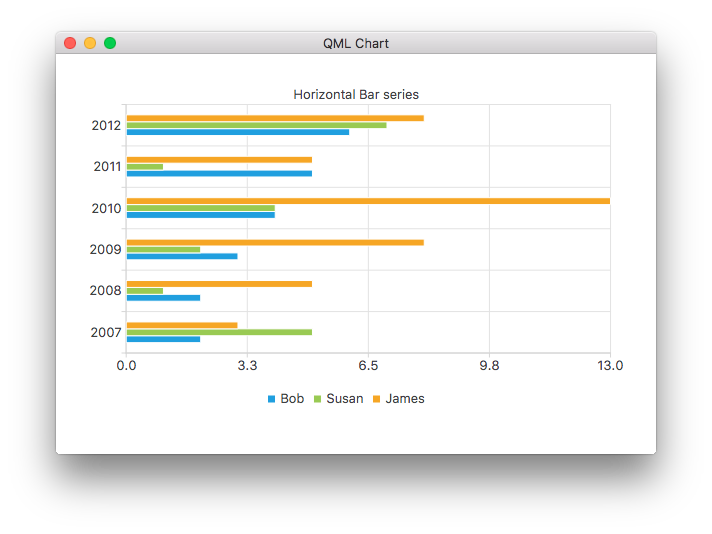
ChartView {
    title: "Horizontal Bar Chart"
    anchors.fill: parent
    legend.alignment: Qt.AlignBottom
    antialiasing: true

    HorizontalBarSeries {
        axisY: BarCategoryAxis { categories: ["2007", "2008", "2009", "2010", "2011", "2012" ] }
        BarSet { label: "Bob"; values: [2, 2, 3, 4, 5, 6] }
        BarSet { label: "Susan"; values: [5, 1, 2, 4, 1, 7] }
        BarSet { label: "James"; values: [3, 5, 8, 13, 5, 8] }
    }
}
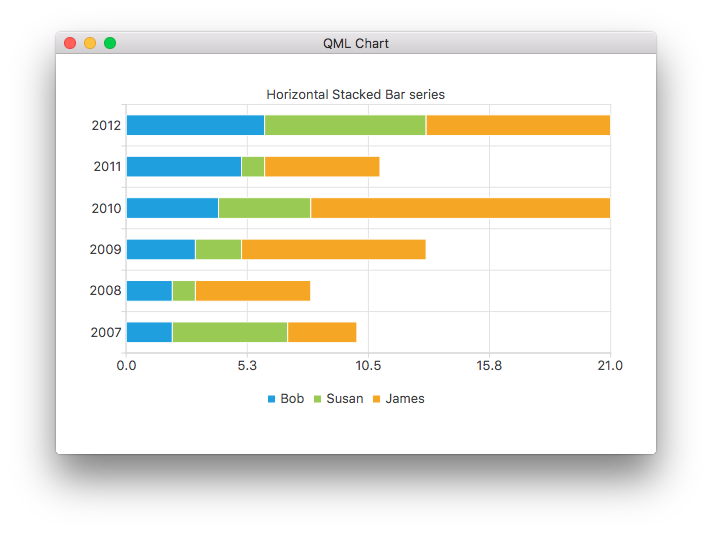
ChartView {
    title: "Horizontal Stacked Bar Chart"
    anchors.fill: parent
    legend.alignment: Qt.AlignBottom
    antialiasing: true

    HorizontalStackedBarSeries {
        axisY: BarCategoryAxis { categories: ["2007", "2008", "2009", "2010", "2011", "2012" ] }
        BarSet { label: "Bob"; values: [2, 2, 3, 4, 5, 6] }
        BarSet { label: "Susan"; values: [5, 1, 2, 4, 1, 7] }
        BarSet { label: "James"; values: [3, 5, 8, 13, 5, 8] }
    }
}
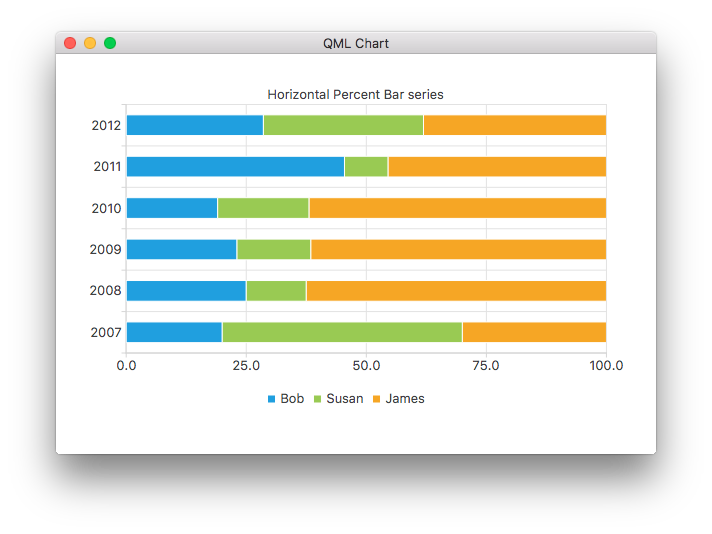
ChartView {
    title: "Horizontal Percent Bar Chart"
    anchors.fill: parent
    legend.alignment: Qt.AlignBottom
    antialiasing: true

    HorizontalPercentBarSeries {
        axisY: BarCategoryAxis { categories: ["2007", "2008", "2009", "2010", "2011", "2012" ] }
        BarSet { label: "Bob"; values: [2, 2, 3, 4, 5, 6] }
        BarSet { label: "Susan"; values: [5, 1, 2, 4, 1, 7] }
        BarSet { label: "James"; values: [3, 5, 8, 13, 5, 8] }
    }
}
두 개의 파이 계열이 있는 도넛 차트를 만드는 방법을 보여드립니다:
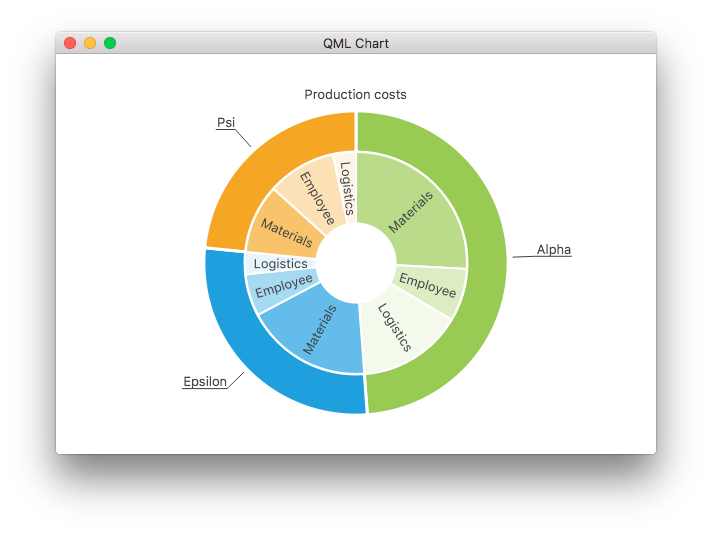
ChartView {
    id: chart
    title: "Production Costs"
    anchors.fill: parent
    legend.visible: false
    antialiasing: true

    PieSeries {
        id: pieOuter
        size: 0.96
        holeSize: 0.7
        PieSlice { id: slice; label: "Alpha"; value: 19511; color: "#99CA53" }
        PieSlice { label: "Epsilon"; value: 11105; color: "#209FDF" }
        PieSlice { label: "Psi"; value: 9352; color: "#F6A625" }
    }

    PieSeries {
        size: 0.7
        id: pieInner
        holeSize: 0.25

        PieSlice { label: "Materials"; value: 10334; color: "#B9DB8A" }
        PieSlice { label: "Employee"; value: 3066; color: "#DCEDC4" }
        PieSlice { label: "Logistics"; value: 6111; color: "#F3F9EB" }

        PieSlice { label: "Materials"; value: 7371; color: "#63BCE9" }
        PieSlice { label: "Employee"; value: 2443; color: "#A6D9F2" }
        PieSlice { label: "Logistics"; value: 1291; color: "#E9F5FC" }

        PieSlice { label: "Materials"; value: 4022; color: "#F9C36C" }
        PieSlice { label: "Employee"; value: 3998; color: "#FCE1B6" }
        PieSlice { label: "Logistics"; value: 1332; color: "#FEF5E7" }
    }

    Component.onCompleted: {
        // Set the common slice properties dynamically for convenience
        for (var i = 0; i < pieOuter.count; i++) {
            pieOuter.at(i).labelPosition = PieSlice.LabelOutside;
            pieOuter.at(i).labelVisible = true;
            pieOuter.at(i).borderWidth = 3;
        }
        for (var i = 0; i < pieInner.count; i++) {
            pieInner.at(i).labelPosition = PieSlice.LabelInsideNormal;
            pieInner.at(i).labelVisible = true;
            pieInner.at(i).borderWidth = 2;
        }
    }
}
또한 안티앨리어싱은 Qt Quick 2의 qml 속성으로 설정됩니다.
더 많은 차트
이 예제 앱의 나머지 차트에 대한 안내는 다음 링크를 참조하세요.
차트뷰 및 시리즈의 다양한 시각적 속성을 사용자 지정하는 방법을 보여줍니다. | |
나만의 사용자 지정 범례를 만드는 방법을 보여줍니다. | |
QML 애플리케이션에서 축을 사용하는 방법을 보여줍니다. | |
F1 범례 차트를 구현하여 데이터 소스로서의 목록 모델을 보여줍니다. | |
QML 애플리케이션에서 몇 가지 다른 극좌표 차트를 만드는 방법을 보여줍니다. |
© 2025 The Qt Company Ltd. Documentation contributions included herein are the copyrights of their respective owners. The documentation provided herein is licensed under the terms of the GNU Free Documentation License version 1.3 as published by the Free Software Foundation. Qt and respective logos are trademarks of The Qt Company Ltd. in Finland and/or other countries worldwide. All other trademarks are property of their respective owners.

