StocQt
100개 종목에 대한 구성 가능한 주식 차트입니다.
StocQt 애플리케이션은 NASDAQ-100을 기준으로 100개 종목의 사용자 지정 목록에 대한 추세 차트를 표시합니다. 사용자가 목록에서 종목을 선택할 수 있습니다. 또한 이 애플리케이션은 비교 차트에 사용할 주식을 최대 5개까지 즐겨찾기할 수 있습니다.
이 애플리케이션은 검색, 주식 체크 박스, 주식 차트, 주식 뷰 및 설정 뷰와 같은 여러 사용자 지정 유형을 사용합니다. 이러한 유형은 주식 데이터를 읽기 쉬운 형태로 표시하고 사용자가 추세 차트를 사용자 지정할 수 있도록 합니다. 예를 들어 사용자는 주별, 월별, 분기별 또는 반기별 주가 추세를 보도록 선택할 수 있습니다.
이 애플리케이션은 API 요청 및 관심 종목 지정과 같은 데이터 처리를 위해 C++로 구현된 사용자 지정 StockEngine 싱글톤을 사용합니다. 이 애플리케이션은 온라인 데이터를 가져오기 위해 사용자 지정 APIHandler 클래스를 구현합니다.
void ApiHandler::stockHistory(const QString &symbol,
                              std::function<void(QList<HistoryData>)> onComplete)
애플리케이션은 ObjectModel 유형을 사용하여 의존하는 시각적 데이터 모델에 액세스합니다.
    id: mainWindow
        ...
    ListView {
        id: root
        ...
        model: ObjectModel {
            Item {
                id: stockContainer
                width: root.width
                height: root.height
                StockView {
                    id: stockView
                    anchors.fill: parent
                    visible: false
                    width: root.width
                    height: root.height
                    stateGroup: stateList
                }

                StockListView {
                    id: listView
                    visible: true
                    anchors.fill: parent
                    width: root.width
                    height: root.height
                    stateGroup: stateList
                }
            }

            FavoriteView {
                id: favoriteView
                width: root.width
                height: root.height
            }

            SettingsView {
                id: infoView
                width: root.width
                height: root.height
            }
        }
    }
StockListModel은 주식 ID, 이름, 가치, 즐겨찾기 등의 기본 정보와 함께 주식을 나열하는 사용자 지정 데이터 모델입니다. 이 애플리케이션은 사용자가 목록에서 다른 종목을 선택하려는 경우 이 데이터 모델을 사용합니다.
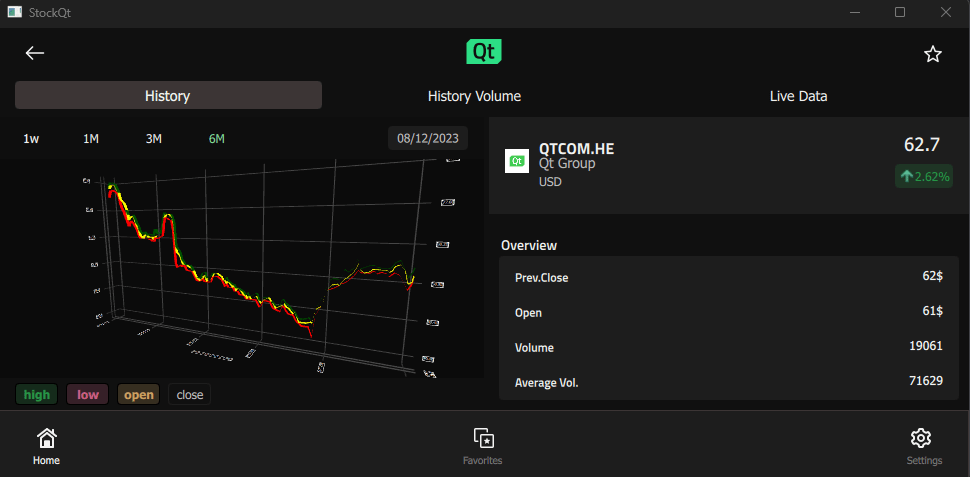
StockView 및 FavoriteView는 선택한 주식 또는 최대 5개 주식의 그룹에 대한 추세 차트를 표시하는 복잡한 데이터 모델입니다. 이들은 또 다른 사용자 지정 유형인 StockChart 또는 FavoriteChart를 사용하여 StockEngine의 데이터를 ListModels로 로드하고 Surface3D, Bars3D 또는 Scatter3D 를 사용하여 주가의 그래픽 추세를 표시합니다.
Rectangle {
    id: chart
        ...
    function updateHistory(){
        updateStartDate()
        let startPoint = StockEngine.stockModel.indexOf(startDate)
        let totalPoints = StockEngine.stockModel.historyCount()

        let width = startPoint / 50
        for (let i = 0; i < totalPoints; i++) {
            let epochInDays = StockEngine.stockModel.historyDate(i, false) / 86400
            appendSurfacePoint(openModel, width, epochInDays, StockEngine.stockModel.openPrice(i))
            appendSurfacePoint(closeModel,width, epochInDays, StockEngine.stockModel.closePrice(i))
            appendSurfacePoint(highModel,width, epochInDays, StockEngine.stockModel.highPrice(i))
            appendSurfacePoint(lowModel,width, epochInDays, StockEngine.stockModel.lowPrice(i))
        }
        ...
    Surface3D {
        id: historyGraph
        ...
            Surface3DSeries {
                id: highSeries
                visible: true
                baseColor: "green"
                shading: Surface3DSeries.Shading.Flat
                drawMode: Surface3DSeries.DrawSurface
                itemLabelFormat: "Time: @xLabel High:@yLabel$"
                ItemModelSurfaceDataProxy {
                    itemModel: highModel
                    rowRole: "row"
                    columnRole: "column"
                    yPosRole: "value"
                }
            },
설정 보기는 애플리케이션에 대한 정보를 표시합니다.
애플리케이션을 더 잘 이해하려면 Qt Creator 을 사용하여 코드를 살펴보세요.
예제 실행하기
에서 예제를 실행하려면 Qt Creator에서 예제를 실행하려면 Welcome 모드를 열고 Examples 에서 예제를 선택합니다. 자세한 내용은 Qt Creator: 튜토리얼을 참조하세요 : 빌드 및 실행을 참조하세요.
QML 애플리케이션도참조하세요 .
© 2026 The Qt Company Ltd. Documentation contributions included herein are the copyrights of their respective owners. The documentation provided herein is licensed under the terms of the GNU Free Documentation License version 1.3 as published by the Free Software Foundation. Qt and respective logos are trademarks of The Qt Company Ltd. in Finland and/or other countries worldwide. All other trademarks are property of their respective owners.
