ScatterSeries QML Type
ScatterSeries 类型在散点图中显示数据。更多
| Import Statement: | import QtCharts 2.11 |
| In C++: | QScatterSeries |
| Inherits: |
属性
- borderColor : color
- borderWidth : real
- brush : brush
- brushFilename : string
- count : int
- markerShape : enumeration
- markerSize : real
详细说明
散点数据以点集合的形式显示在图表上。为每个点指定两个值,以确定其在横轴和纵轴上的位置。
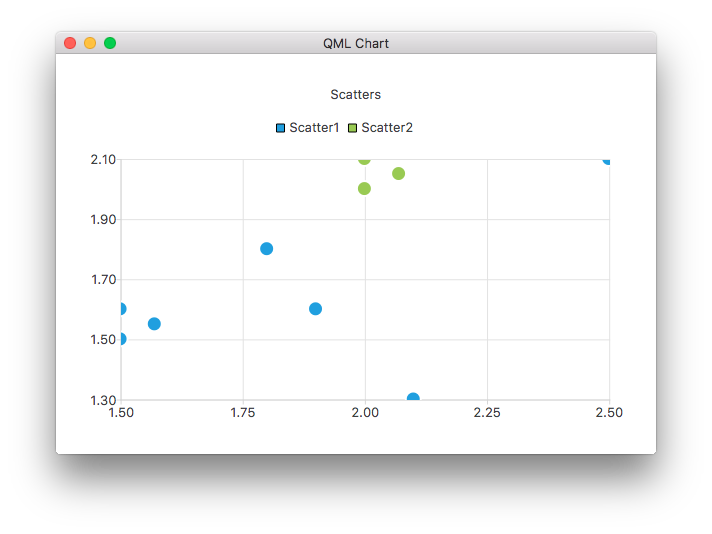
下面的 QML 代码展示了如何用两个简单的散点系列创建图表:
ChartView {
    title: "Scatter Chart"
    anchors.fill: parent
    antialiasing: true

    ScatterSeries {
        id: scatter1
        name: "Scatter A"
        XYPoint { x: 1.5; y: 1.5 }
        XYPoint { x: 1.5; y: 1.6 }
        XYPoint { x: 1.57; y: 1.55 }
        XYPoint { x: 1.8; y: 1.8 }
        XYPoint { x: 1.9; y: 1.6 }
        XYPoint { x: 2.1; y: 1.3 }
        XYPoint { x: 2.5; y: 2.1 }
    }

    ScatterSeries {
        name: "Scatter B"
        XYPoint { x: 2.0; y: 2.0 }
        XYPoint { x: 2.0; y: 2.1 }
        XYPoint { x: 2.07; y: 2.05 }
        XYPoint { x: 2.2; y: 2.9 }
        XYPoint { x: 2.4; y: 2.7 }
        XYPoint { x: 2.67; y: 2.65 }
    }
}
更多信息,请参阅QML 图库中的图表。
属性文档
borderColor : color
用于绘制标记边框的颜色。
borderWidth : real
边界线的宽度。默认情况下,宽度为 2.0。
brush : brush
用于绘制散点系列标记的笔刷。
brushFilename : string
用作系列画笔的文件名。
count : int
系列中数据点的数量。
markerShape : enumeration
渲染标记项时使用的形状:
| 常量 | 说明 |
|---|---|
ScatterSeries.MarkerShapeCircle | 标记为圆形。这是默认值。 |
ScatterSeries.MarkerShapeRectangle | 标记为矩形。 |
markerSize : real
用于渲染序列中点的标记大小。
© 2026 The Qt Company Ltd. Documentation contributions included herein are the copyrights of their respective owners. The documentation provided herein is licensed under the terms of the GNU Free Documentation License version 1.3 as published by the Free Software Foundation. Qt and respective logos are trademarks of The Qt Company Ltd. in Finland and/or other countries worldwide. All other trademarks are property of their respective owners.
