QML 图库中的图表
演示如何使用 qml 来使用不同的图表类型。
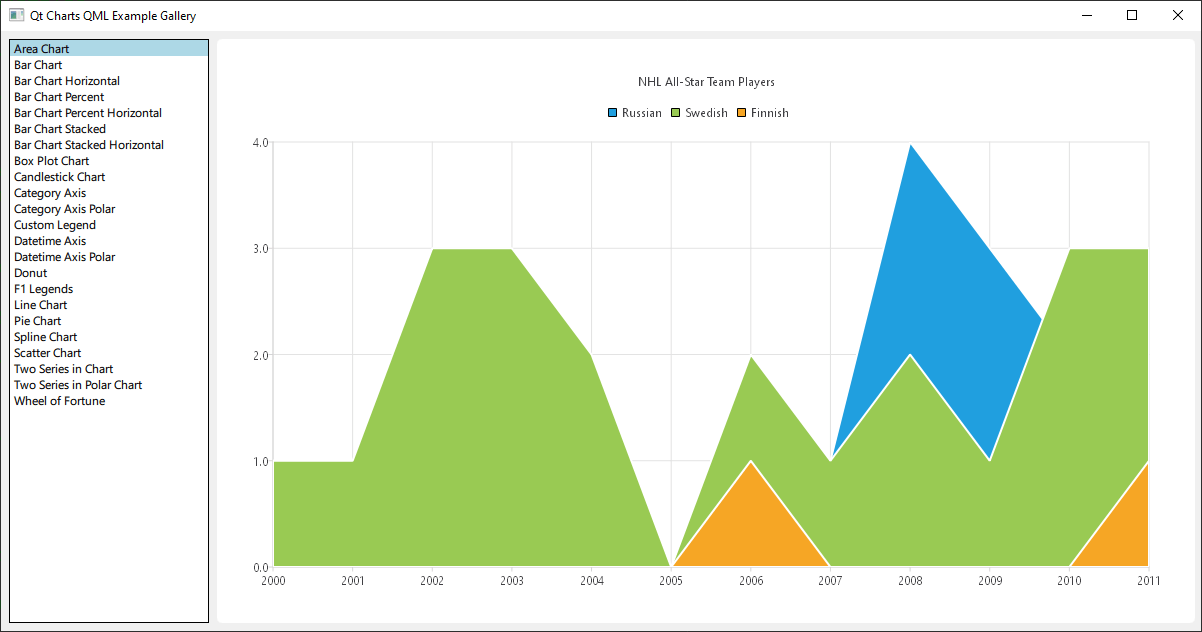
运行示例
要运行来自 Qt Creator,打开Welcome 模式,然后从Examples 中选择示例。更多信息,请参阅Qt Creator: 教程:构建并运行。
这是一个Qt Quick 应用程序,每种图表类型的文件都位于示例文件夹下的 qml 目录中,并通过位于该示例目录下的 main.qml 加载到ListView 中。
本文档的重点不是顶层布局或加载,而是Qt Charts QML API 的使用。
包括依赖项
所有 .qml 文件都以
import QtQuick
import QtCharts
用 QML 创建图表
创建每种图表类型都从创建ChartView 开始。
要创建饼图,我们使用PieSeries API 和一些 PieSlices:
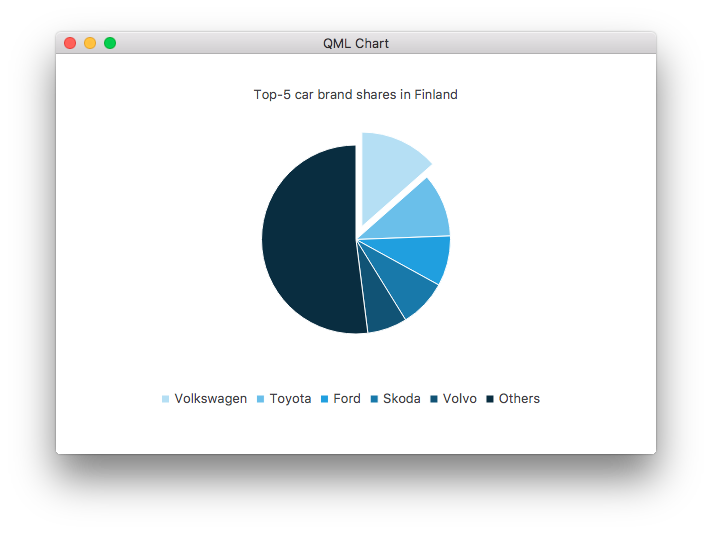
ChartView {
    id: chart
    title: "Top-5 car brand shares in Finland"
    anchors.fill: parent
    legend.alignment: Qt.AlignBottom
    antialiasing: true

    property variant othersSlice: 0

    PieSeries {
        id: pieSeries
        PieSlice { label: "Volkswagen"; value: 13.5 }
        PieSlice { label: "Toyota"; value: 10.9 }
        PieSlice { label: "Ford"; value: 8.6 }
        PieSlice { label: "Skoda"; value: 8.2 }
        PieSlice { label: "Volvo"; value: 6.8 }
    }

    Component.onCompleted: {
        // You can also manipulate slices dynamically, like append a slice or set a slice exploded
        othersSlice = pieSeries.append("Others", 52.0);
        pieSeries.find("Volkswagen").exploded = true;
    }
}
您可以用线性序列创建图表:
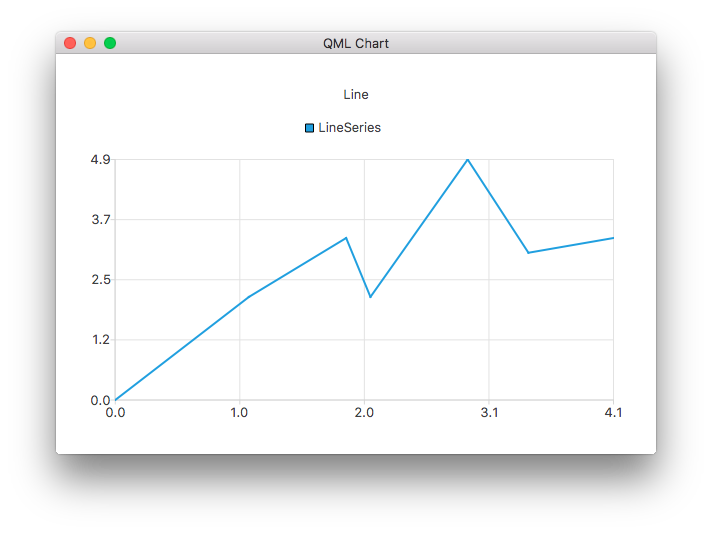
ChartView {
    title: "Line Chart"
    anchors.fill: parent
    antialiasing: true

    LineSeries {
        name: "Line"
        XYPoint { x: 0; y: 0 }
        XYPoint { x: 1.1; y: 2.1 }
        XYPoint { x: 1.9; y: 3.3 }
        XYPoint { x: 2.1; y: 2.1 }
        XYPoint { x: 2.9; y: 4.9 }
        XYPoint { x: 3.4; y: 3.0 }
        XYPoint { x: 4.1; y: 3.3 }
    }
}
和样条线系列:
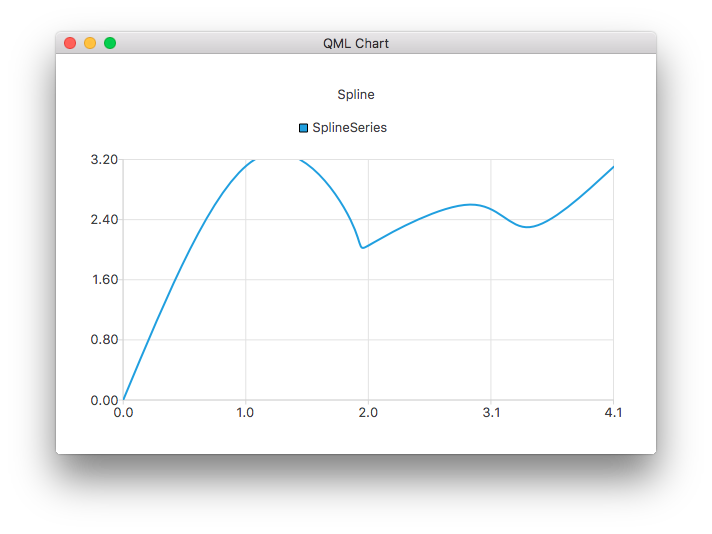
ChartView {
    title: "Spline Chart"
    anchors.fill: parent
    antialiasing: true

    SplineSeries {
        name: "Spline"
        XYPoint { x: 0; y: 0.0 }
        XYPoint { x: 1.1; y: 3.2 }
        XYPoint { x: 1.9; y: 2.4 }
        XYPoint { x: 2.1; y: 2.1 }
        XYPoint { x: 2.9; y: 2.6 }
        XYPoint { x: 3.4; y: 2.3 }
        XYPoint { x: 4.1; y: 3.1 }
    }
}
您可以使用三个区域系列创建一个图表,说明 NHL 全明星球员的选择情况:
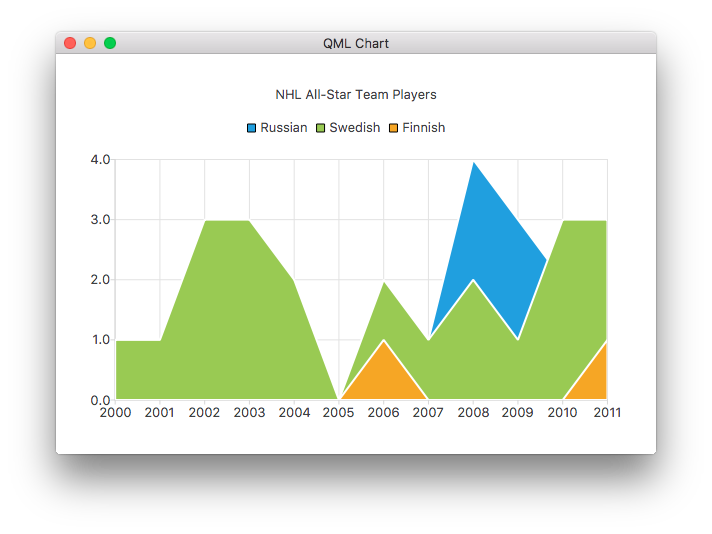
ChartView {
    title: "NHL All-Star Team Players"
    anchors.fill: parent
    antialiasing: true

    // Define x-axis to be used with the series instead of default one
    ValueAxis {
        id: valueAxis
        min: 2000
        max: 2011
        tickCount: 12
        labelFormat: "%.0f"
    }

    AreaSeries {
        name: "Russian"
        axisX: valueAxis
        upperSeries: LineSeries {
            XYPoint { x: 2000; y: 1 }
            XYPoint { x: 2001; y: 1 }
            XYPoint { x: 2002; y: 1 }
            XYPoint { x: 2003; y: 1 }
            XYPoint { x: 2004; y: 1 }
            XYPoint { x: 2005; y: 0 }
            XYPoint { x: 2006; y: 1 }
            XYPoint { x: 2007; y: 1 }
            XYPoint { x: 2008; y: 4 }
            XYPoint { x: 2009; y: 3 }
            XYPoint { x: 2010; y: 2 }
            XYPoint { x: 2011; y: 1 }
        }
    }
    ...
然后是几个散点系列:
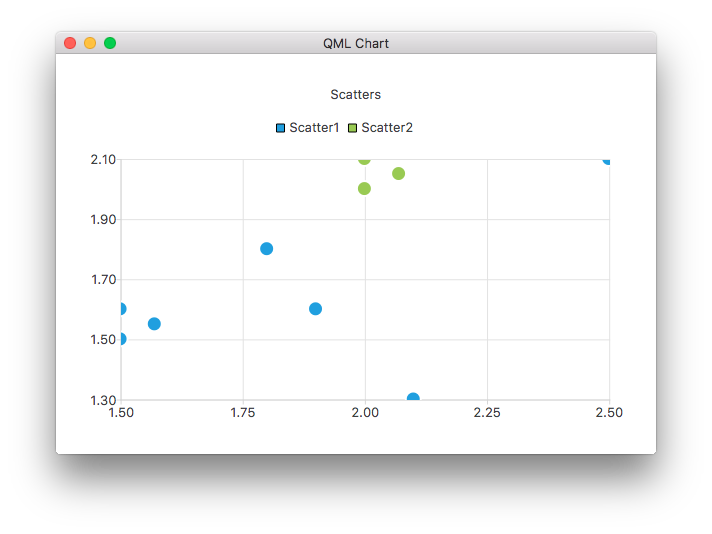
ChartView {
    title: "Scatter Chart"
    anchors.fill: parent
    antialiasing: true

    ScatterSeries {
        id: scatter1
        name: "Scatter A"
        XYPoint { x: 1.5; y: 1.5 }
        XYPoint { x: 1.5; y: 1.6 }
        XYPoint { x: 1.57; y: 1.55 }
        XYPoint { x: 1.8; y: 1.8 }
        XYPoint { x: 1.9; y: 1.6 }
        XYPoint { x: 2.1; y: 1.3 }
        XYPoint { x: 2.5; y: 2.1 }
    }

    ScatterSeries {
        name: "Scatter B"
        XYPoint { x: 2.0; y: 2.0 }
        XYPoint { x: 2.0; y: 2.1 }
        XYPoint { x: 2.07; y: 2.05 }
        XYPoint { x: 2.2; y: 2.9 }
        XYPoint { x: 2.4; y: 2.7 }
        XYPoint { x: 2.67; y: 2.65 }
    }
}
    ...
以及几个不同的条形序列:
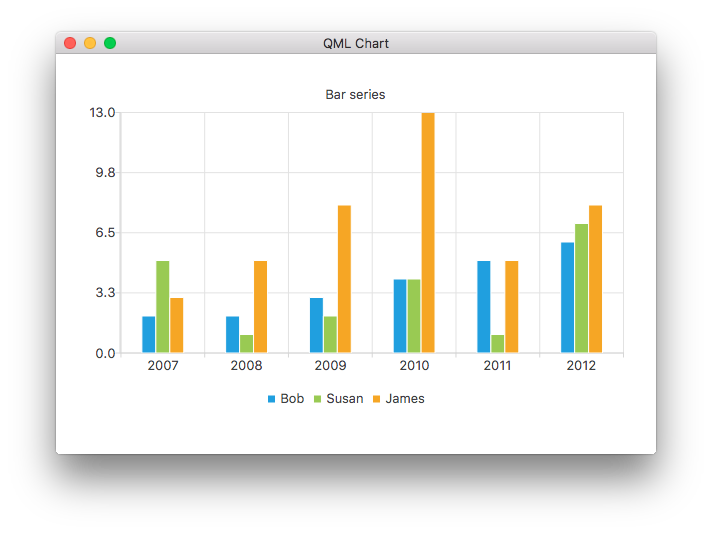
ChartView {
    title: "Bar Chart"
    anchors.fill: parent
    legend.alignment: Qt.AlignBottom
    antialiasing: true

    BarSeries {
        id: mySeries
        axisX: BarCategoryAxis { categories: ["2007", "2008", "2009", "2010", "2011", "2012" ] }
        BarSet { label: "Bob"; values: [2, 2, 3, 4, 5, 6] }
        BarSet { label: "Susan"; values: [5, 1, 2, 4, 1, 7] }
        BarSet { label: "James"; values: [3, 5, 8, 13, 5, 8] }
    }
}
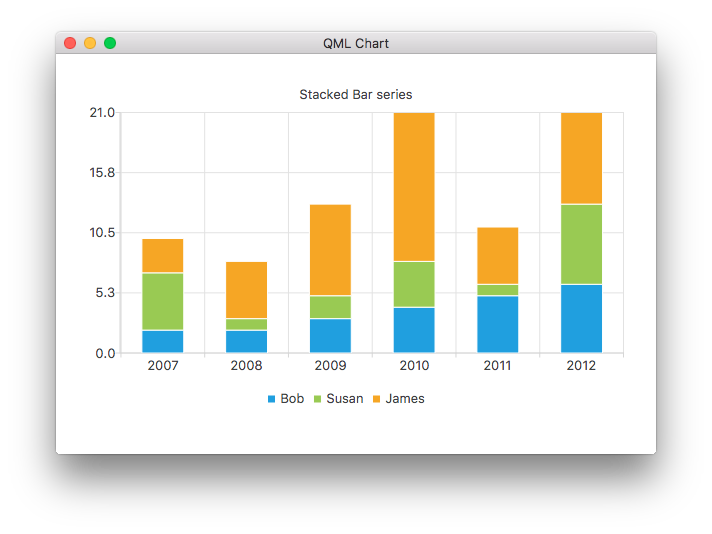
ChartView {
    title: "Stacked Bar Chart"
    anchors.fill: parent
    legend.alignment: Qt.AlignBottom
    antialiasing: true

    StackedBarSeries {
        axisX: BarCategoryAxis { categories: ["2007", "2008", "2009", "2010", "2011", "2012" ] }
        BarSet { label: "Bob"; values: [2, 2, 3, 4, 5, 6] }
        BarSet { label: "Susan"; values: [5, 1, 2, 4, 1, 7] }
        BarSet { label: "James"; values: [3, 5, 8, 13, 5, 8] }
    }
}
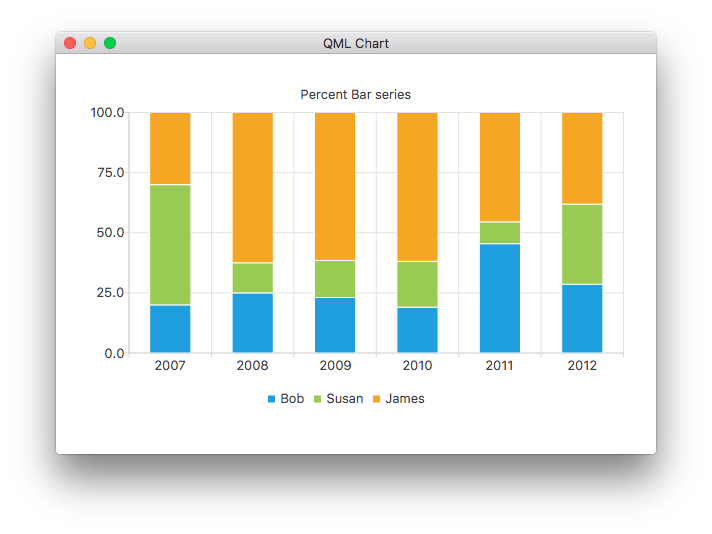
ChartView {
    title: "Percent Bar Chart"
    anchors.fill: parent
    legend.alignment: Qt.AlignBottom
    antialiasing: true

    PercentBarSeries {
        axisX: BarCategoryAxis { categories: ["2007", "2008", "2009", "2010", "2011", "2012" ] }
        BarSet { label: "Bob"; values: [2, 2, 3, 4, 5, 6] }
        BarSet { label: "Susan"; values: [5, 1, 2, 4, 1, 7] }
        BarSet { label: "James"; values: [3, 5, 8, 13, 5, 8] }
    }
}
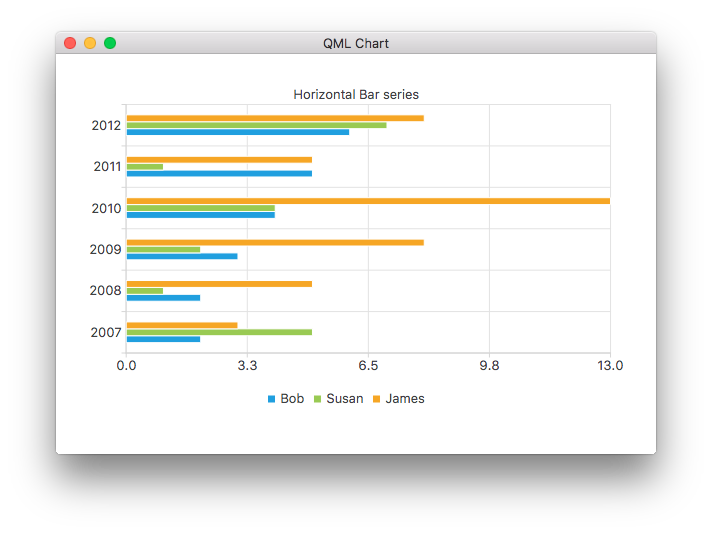
ChartView {
    title: "Horizontal Bar Chart"
    anchors.fill: parent
    legend.alignment: Qt.AlignBottom
    antialiasing: true

    HorizontalBarSeries {
        axisY: BarCategoryAxis { categories: ["2007", "2008", "2009", "2010", "2011", "2012" ] }
        BarSet { label: "Bob"; values: [2, 2, 3, 4, 5, 6] }
        BarSet { label: "Susan"; values: [5, 1, 2, 4, 1, 7] }
        BarSet { label: "James"; values: [3, 5, 8, 13, 5, 8] }
    }
}
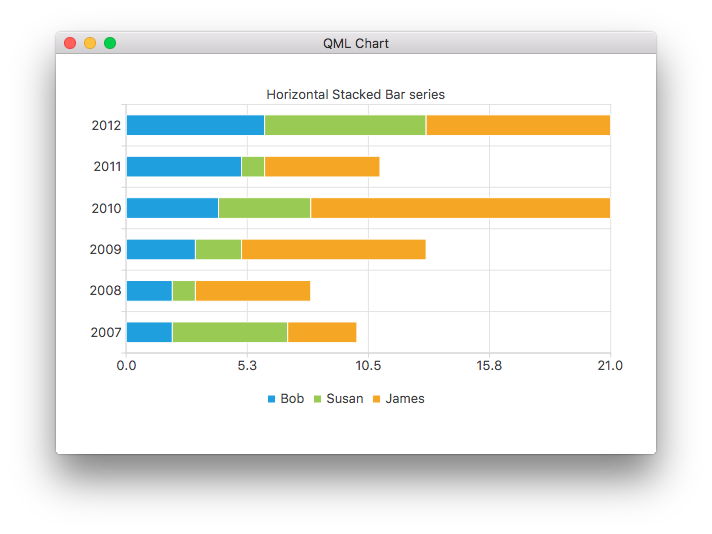
ChartView {
    title: "Horizontal Stacked Bar Chart"
    anchors.fill: parent
    legend.alignment: Qt.AlignBottom
    antialiasing: true

    HorizontalStackedBarSeries {
        axisY: BarCategoryAxis { categories: ["2007", "2008", "2009", "2010", "2011", "2012" ] }
        BarSet { label: "Bob"; values: [2, 2, 3, 4, 5, 6] }
        BarSet { label: "Susan"; values: [5, 1, 2, 4, 1, 7] }
        BarSet { label: "James"; values: [3, 5, 8, 13, 5, 8] }
    }
}
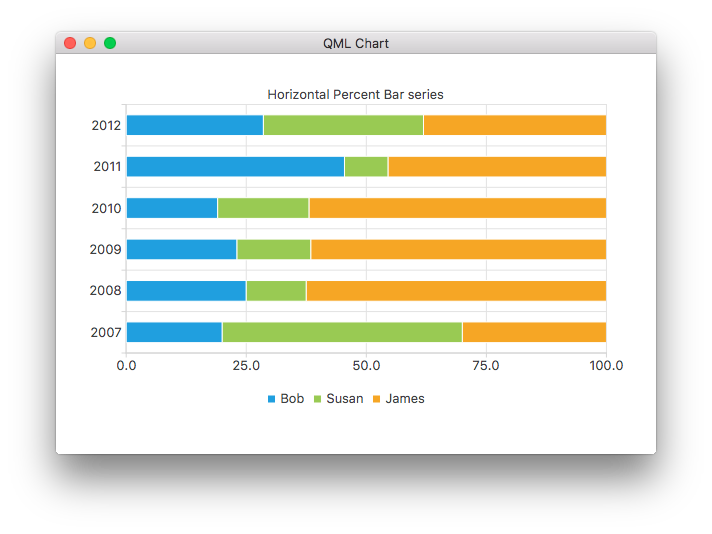
ChartView {
    title: "Horizontal Percent Bar Chart"
    anchors.fill: parent
    legend.alignment: Qt.AlignBottom
    antialiasing: true

    HorizontalPercentBarSeries {
        axisY: BarCategoryAxis { categories: ["2007", "2008", "2009", "2010", "2011", "2012" ] }
        BarSet { label: "Bob"; values: [2, 2, 3, 4, 5, 6] }
        BarSet { label: "Susan"; values: [5, 1, 2, 4, 1, 7] }
        BarSet { label: "James"; values: [3, 5, 8, 13, 5, 8] }
    }
}
这演示了如何使用两个饼系列创建甜甜圈图表:
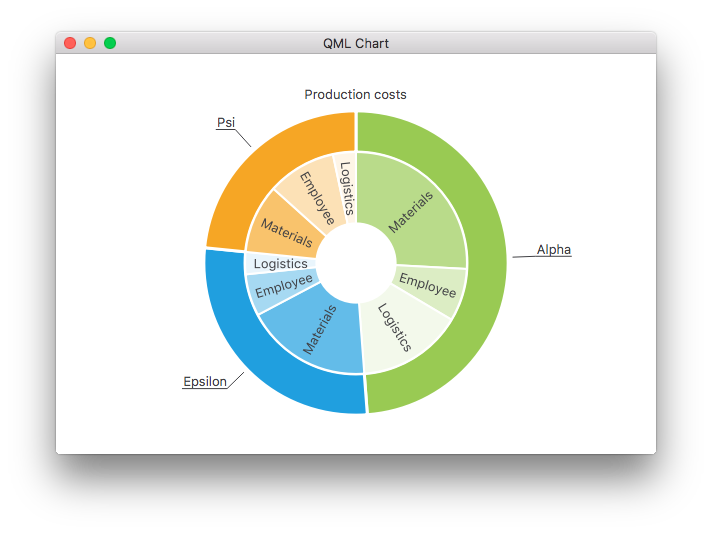
ChartView {
    id: chart
    title: "Production Costs"
    anchors.fill: parent
    legend.visible: false
    antialiasing: true

    PieSeries {
        id: pieOuter
        size: 0.96
        holeSize: 0.7
        PieSlice { id: slice; label: "Alpha"; value: 19511; color: "#99CA53" }
        PieSlice { label: "Epsilon"; value: 11105; color: "#209FDF" }
        PieSlice { label: "Psi"; value: 9352; color: "#F6A625" }
    }

    PieSeries {
        size: 0.7
        id: pieInner
        holeSize: 0.25

        PieSlice { label: "Materials"; value: 10334; color: "#B9DB8A" }
        PieSlice { label: "Employee"; value: 3066; color: "#DCEDC4" }
        PieSlice { label: "Logistics"; value: 6111; color: "#F3F9EB" }

        PieSlice { label: "Materials"; value: 7371; color: "#63BCE9" }
        PieSlice { label: "Employee"; value: 2443; color: "#A6D9F2" }
        PieSlice { label: "Logistics"; value: 1291; color: "#E9F5FC" }

        PieSlice { label: "Materials"; value: 4022; color: "#F9C36C" }
        PieSlice { label: "Employee"; value: 3998; color: "#FCE1B6" }
        PieSlice { label: "Logistics"; value: 1332; color: "#FEF5E7" }
    }

    Component.onCompleted: {
        // Set the common slice properties dynamically for convenience
        for (var i = 0; i < pieOuter.count; i++) {
            pieOuter.at(i).labelPosition = PieSlice.LabelOutside;
            pieOuter.at(i).labelVisible = true;
            pieOuter.at(i).borderWidth = 3;
        }
        for (var i = 0; i < pieInner.count; i++) {
            pieInner.at(i).labelPosition = PieSlice.LabelInsideNormal;
            pieInner.at(i).labelVisible = true;
            pieInner.at(i).borderWidth = 2;
        }
    }
}
此外,还可在Qt Quick 2 中使用 qml 属性设置抗锯齿。
更多图表
请参阅以下链接,了解本示例应用程序中的其余图表。
向您展示如何自定义 ChartView 和系列的不同可视化属性。 | |
演示如何创建自己的自定义图例。 | |
演示如何在 QML 应用程序中使用坐标轴。 | |
执行 F1 Legends Chart 来演示作为数据源的列表模型。 | |
展示如何在 QML 应用程序中制作几种不同的极坐标图。 |
© 2025 The Qt Company Ltd. Documentation contributions included herein are the copyrights of their respective owners. The documentation provided herein is licensed under the terms of the GNU Free Documentation License version 1.3 as published by the Free Software Foundation. Qt and respective logos are trademarks of The Qt Company Ltd. in Finland and/or other countries worldwide. All other trademarks are property of their respective owners.

