QML에서 축 사용
참고: 이 예제는 QML을 사용한 차트 갤러리 예제의 일부입니다.
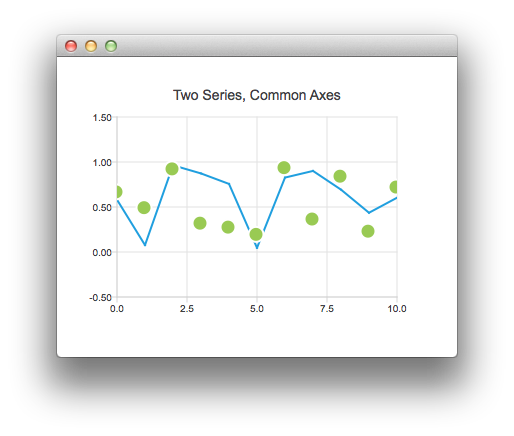
먼저 임의의 데이터가 포함된 선형 계열과 분산형 계열이 있는 차트로 시작합니다. 그런 다음 공통 축을 공유하는 두 개의 계열이 있는 그래프가 있습니다.

ChartView {
    title: "Two Series, Common Axes"
    anchors.fill: parent
    legend.visible: false
    antialiasing: true

    ValueAxis {
        id: axisX
        min: 0
        max: 10
        tickCount: 5
    }

    ValueAxis {
        id: axisY
        min: -0.5
        max: 1.5
    }

    LineSeries {
        id: series1
        axisX: axisX
        axisY: axisY
    }

    ScatterSeries {
        id: series2
        axisX: axisX
        axisY: axisY
    }

    // Add data dynamically to the series
    Component.onCompleted: {
        for (var i = 0; i <= 10; i++) {
            series1.append(i, Math.random());
            series2.append(i, Math.random());
        }
    }
}
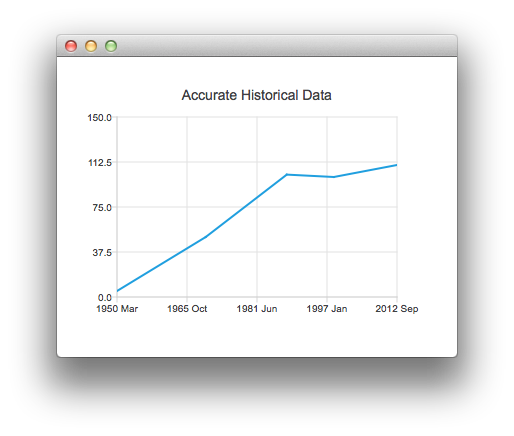
이 차트는 정확한 과거 데이터를 보여줍니다. 이 차트는 DateTimeAxis 를 사용하는 다음 코드 조각으로 만들어집니다.

ChartView {
    id: root
    title: "Accurate Historical Data"
    anchors.fill: parent
    legend.visible: false
    antialiasing: true

    LineSeries {
        axisX: DateTimeAxis {
            format: "yyyy MMM"
            tickCount: 5
        }
        axisY: ValueAxis {
            min: 0
            max: 150
        }

        // Please note that month in JavaScript months are zero based, so 2 means March
        XYPoint { x: root.toMsecsSinceEpoch(new Date(1950, 2, 15)); y: 5 }
        XYPoint { x: root.toMsecsSinceEpoch(new Date(1970, 0, 1)); y: 50 }
        XYPoint { x: root.toMsecsSinceEpoch(new Date(1987, 12, 31)); y: 102 }
        XYPoint { x: root.toMsecsSinceEpoch(new Date(1998, 7, 1)); y: 100 }
        XYPoint { x: root.toMsecsSinceEpoch(new Date(2012, 8, 2)); y: 110 }
    }

    // DateTimeAxis is based on QDateTimes so we must convert our JavaScript dates to
    // milliseconds since epoch to make them match the DateTimeAxis values
    function toMsecsSinceEpoch(date) {
        var msecs = date.getTime();
        return msecs;
    }
}
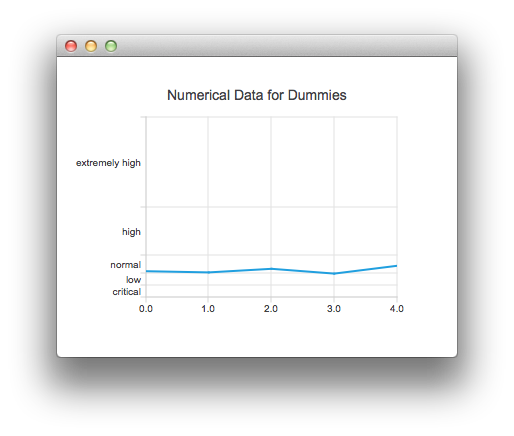
다음 차트는 데이터를 더 쉽게 이해할 수 있도록 CategoryAxis 을 사용하여 만들었습니다.

ChartView {
    title: "Numerical Data for Dummies"
    anchors.fill: parent
    legend.visible: false
    antialiasing: true

    LineSeries {
        axisY: CategoryAxis {
            min: 0
            max: 30
            CategoryRange {
                label: "critical"
                endValue: 2
            }
            CategoryRange {
                label: "low"
                endValue: 4
            }
            CategoryRange {
                label: "normal"
                endValue: 7
            }
            CategoryRange {
                label: "high"
                endValue: 15
            }
            CategoryRange {
                label: "extremely high"
                endValue: 30
            }
        }

        XYPoint { x: 0; y: 4.3 }
        XYPoint { x: 1; y: 4.1 }
        XYPoint { x: 2; y: 4.7 }
        XYPoint { x: 3; y: 3.9 }
        XYPoint { x: 4; y: 5.2 }
    }
}
© 2025 The Qt Company Ltd. Documentation contributions included herein are the copyrights of their respective owners. The documentation provided herein is licensed under the terms of the GNU Free Documentation License version 1.3 as published by the Free Software Foundation. Qt and respective logos are trademarks of The Qt Company Ltd. in Finland and/or other countries worldwide. All other trademarks are property of their respective owners.

