Qml 날씨
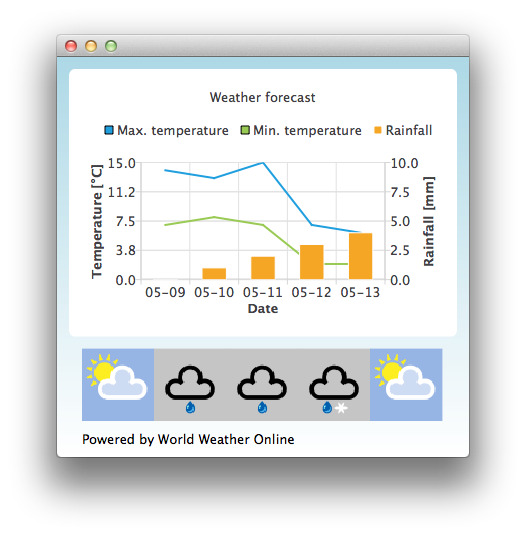
이것은 qml을 사용하여 다양한 차트 유형을 사용하는 방법을 보여주는 기본 데모입니다.

기본적으로 애플리케이션은 정적 테스트 데이터를 사용하여 일기 예보를 모방합니다. World Weather Online에서 제공하는 날씨 API에 액세스하기 위해 http://www.worldweatheronline.com/ 에서 애플리케이션 ID를 얻을 수도 있습니다. 그런 다음 애플리케이션 ID를 QML 날씨 실행 파일에 매개변수로 지정하여 실시간 데이터를 사용하도록 할 수 있습니다.
예를 들어
bin\qmlweather.exe 1234567890abcdef123456
예제 실행하기
에서 예제를 실행하려면 Qt Creator에서 예제를 실행하려면 Welcome 모드를 열고 Examples 에서 예제를 선택합니다. 자세한 내용은 Qt Creator: 튜토리얼을 참조하세요 : 빌드 및 실행을 참조하십시오.
Qt Quick 애플리케이션에서 차트 사용
이 예제 애플리케이션은 ChartView 및 일부 계열을 사용하여 날씨 데이터를 시각화합니다:
ChartView {
    id: chartView
    title: "Weather forecast"
    BarCategoryAxis {
        id: barCategoriesAxis
        titleText: "Date"
    }

    ValueAxis{
        id: valueAxisY2
        min: 0
        max: 10
        titleText: "Rainfall [mm]"
    }

    ValueAxis {
        id: valueAxisX
        // Hide the value axis; it is only used to map the line series to bar categories axis
        visible: false
        min: 0
        max: 5
    }

    ValueAxis{
        id: valueAxisY
        min: 0
        max: 15
        titleText: "Temperature [°C]"
    }

    LineSeries {
        id: maxTempSeries
        axisX: valueAxisX
        axisY: valueAxisY
        name: "Max. temperature"
    }

    LineSeries {
        id: minTempSeries
        axisX: valueAxisX
        axisY: valueAxisY
        name: "Min. temperature"
    }

    BarSeries {
        id: myBarSeries
        axisX: barCategoriesAxis
        axisYRight: valueAxisY2
        BarSet {
            id: rainfallSet
            label: "Rainfall"
        }
    }
일기 예보 데이터가 포함된 데이터를 가져오기 위해 World Weather Online에 HTTP GET 요청을 합니다. JSON 데이터 형식으로 응답을 요청합니다.
// Make HTTP GET request and parse the result
var xhr = new XMLHttpRequest;
xhr.open("GET",
         "http://free.worldweatheronline.com/feed/weather.ashx?q=Jyv%c3%a4skyl%c3%a4,Finland&format=json&num_of_days=5&key="
         + weatherAppKey);
xhr.onreadystatechange = function() {
    if (xhr.readyState == XMLHttpRequest.DONE) {
        var a = JSON.parse(xhr.responseText);
        parseWeatherData(a);
    }
}
xhr.send();
JSON 응답에는 일기 예보 데이터 배열이 포함됩니다:
// Loop through the parsed JSON
for (var i in weatherData.data.weather) {
    var weatherObj = weatherData.data.weather[i];
이 데이터는 시리즈에 대한 입력 데이터와 날씨 아이콘 URL의 컨테이너로 사용하는 ListModel로 사용됩니다:
// Store temperature values, rainfall and weather icon.
// The temperature values begin from 0.5 instead of 0.0 to make the start from the
// middle of the rainfall bars. This makes the temperature lines visually better
// synchronized with the rainfall bars.
maxTempSeries.append(Number(i) + 0.5, weatherObj.tempMaxC);
minTempSeries.append(Number(i) + 0.5, weatherObj.tempMinC);
rainfallSet.append(weatherObj.precipMM);
weatherImageModel.append({"imageSource":weatherObj.weatherIconUrl[0].value});
© 2025 The Qt Company Ltd. Documentation contributions included herein are the copyrights of their respective owners. The documentation provided herein is licensed under the terms of the GNU Free Documentation License version 1.3 as published by the Free Software Foundation. Qt and respective logos are trademarks of The Qt Company Ltd. in Finland and/or other countries worldwide. All other trademarks are property of their respective owners.

