
使用 QML 自定义图表视图
注意:这是 “使用 QML 制作图表”示例库的一部分。
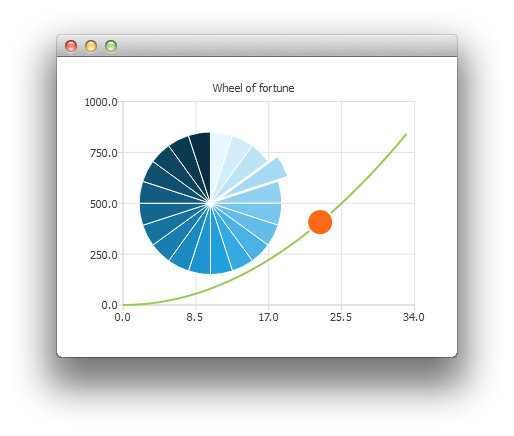
本文将向您展示如何通过自定义饼图系列来制作一个“幸运轮”。
首先,我们创建 ChartView 以及几个数据系列。
ChartView {
    id: chartView
    anchors.fill: parent
    title: "Wheel of Fortune"
    legend.visible: false
    antialiasing: true

    PieSeries {
        id: wheelOfFortune
        horizontalPosition: 0.3
    }

    SplineSeries {
        id: splineSeries
    }

    ScatterSeries {
        id: scatterSeries
    }
}
应用程序数据是在主矩形的 Component.onCompleted 方法中生成的:
Component.onCompleted: {
    __intervalCoefficient = Math.random() + 0.25;

    for (var i = 0; i < 20; i++)
        wheelOfFortune.append("", 1);

    var interval = 1;
    for (var j = 0; interval < 800; j++) {
        interval = __intervalCoefficient * j * j;
        splineSeries.append(j, interval);
    }
    chartView.axisX(scatterSeries).max = j;
    chartView.axisY(scatterSeries).max = 1000;
}
以下自定义操作通过定时器循环执行。为了每次突出显示一个扇区,我们修改其 `exploded` 属性:
wheelOfFortune.at(index).exploded = false;
root.__activeIndex++;
index = root.__activeIndex % wheelOfFortune.count;
wheelOfFortune.at(index).exploded = true;
随后使用包含一个数据点的散点系列实现动画效果:
scatterSeries.clear();
scatterSeries.append(root.__activeIndex, interval);
scatterSeries.color = Qt.tint(scatterSeries.color, "#05FF0000");
scatterSeries.markerSize += 0.5;
当幸运轮停止转动时,我们通过修改其颜色使当前选中的扇区闪烁。
// Switch the colors of the slice and the border
wheelOfFortune.at(index).borderWidth = 2;
switchColor = wheelOfFortune.at(index).borderColor;
wheelOfFortune.at(index).borderColor = wheelOfFortune.at(index).color;
wheelOfFortune.at(index).color = switchColor;
© 2026 The Qt Company Ltd. Documentation contributions included herein are the copyrights of their respective owners. The documentation provided herein is licensed under the terms of the GNU Free Documentation License version 1.3 as published by the Free Software Foundation. Qt and respective logos are trademarks of The Qt Company Ltd. in Finland and/or other countries worldwide. All other trademarks are property of their respective owners.
