
5.5.5. Using the Axivion Visual Studio Code Plugin
The Axivion Visual Studio Code Plugin ships with several commands that extend the functionality of Visual Studio Code. Please refer to the plugin overview in Visual Studio Code (see figure Axivion Visual Studio Code Plugin).
These commands can be triggered by using the Command Palette
(View > Command Palette or using the shortcut Ctrl+Shift+P)
and typing Axivion or clicking the Ax icon in the Visual Studio
Code status bar.
These commands can also be bound to shortcuts using
File > Preferences > Keyboard Shortcuts.
The Axivion Visual Studio Code Plugin offers two Visual Studio Code windows:
Issues View, which lists the issues available for a selected analysis project;Issue Properties, which gives details on a currently selected issue in theIssuesview.
5.5.5.1. Issue View
The Issues View window allows querying new and resolved erosion issues.
The user interface is very similar to the web dashboard described in section
Issue Table and Issue Deltas.
To open the Issues View, please use the command
Axivion: Show Issues View.
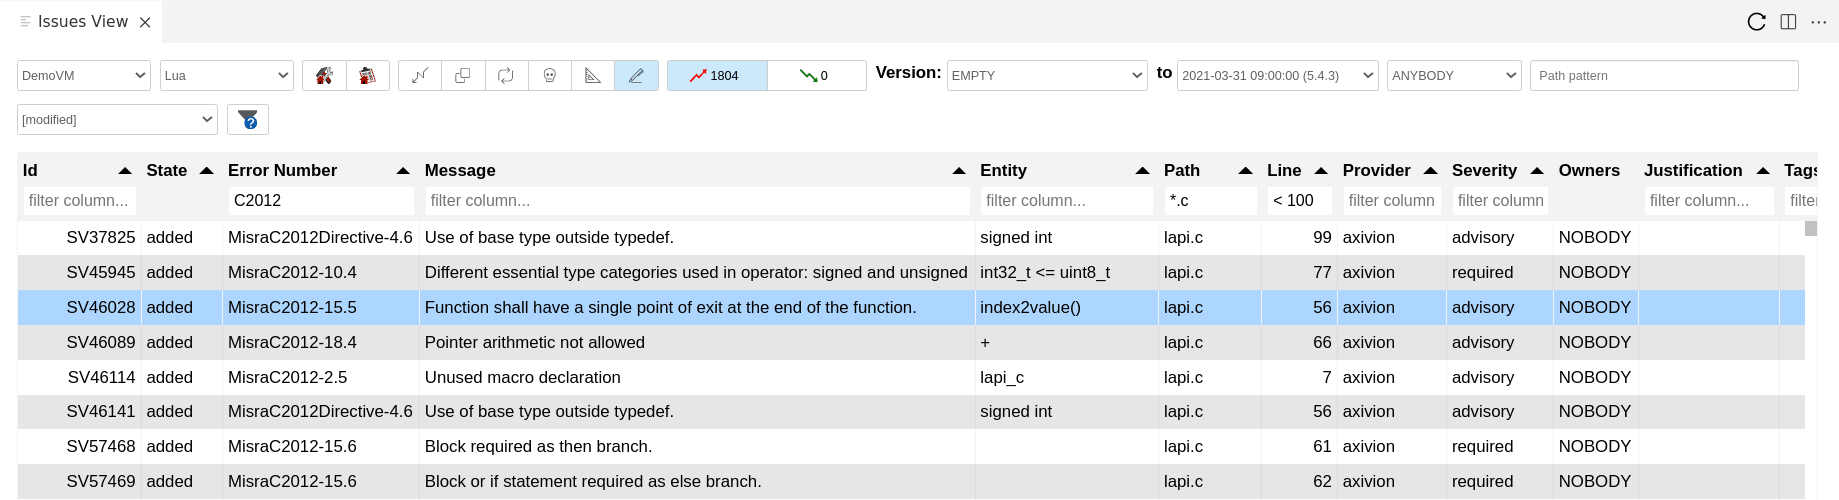
Issues View window
The elements in the toolbar select which issues to display. From left to right:
Dashboard selection: The dashboard selection dropdown allows to quickly change between several dashboards. It is displayed only when more than one dashboard is configured.Project: Allows you to select the analysis project whose issues are viewed. The combobox lists all projects available on the server, which the current user can access.
Start Local Build: Starts the local build. The results are stored in<home>/.bauhaus/localbuild.
View Local Build Results: Switches between the results of the dashboard (global analysis on CI server) and the results of the local build.Issue Kind: Selects which type of issue to display.
State: The two controls with the arrow symbols allow you to view only added issues, only removed issues, or both. The numbers indicate the number of added/removed issues in the current query result.Start Version: Like the web dashboard, the issue list shows the difference between two versions. Issues that exist in the start version but not in the end version are listed asremoved. Issues that exist in the end version but not in the start version are listed asadded. To see all issues, pickEMPTYasStart Version. This special version does not contain any issues, so the list will display all issues in the chosenEnd Version. When a new analysis is available on the Axivion Dashboard Server, the list of available versions in the plugin might not update immediately. In this case, selectRefreshat the top-right corner of the window to force the plugin to download the current list of versions from the Axivion Dashboard Server.As an alternative to the menu, you can also use the command
Axivion: Reload Issues ViewtheIssues Viewhas focus to update the issue list.End Version: The end version for which the issues are to be retrieved. In Local Build mode, the start and end version controls are replaced with a dropdown which allows to quickly select the two available versions or their difference:Reference version,Locally changed issues, andAll local issues.User: Specifies the user whose issues are to be shown:ANYBODY: shows all issues; that is, does not filter based on the user;NOBODY: shows only those issues that are not associated with any user,<user_name>: shows all erosion issues associated with the given user name.
As a normal user, you can see only your own user name as well as those of users marked with the public flag (see Section Users).
Filter: Allows one to specify a globbing pattern. Only the issues associated with a file that matches the specified globbing pattern are shown. For example, the path “src/main/io.c” can be matched by*.cas well as*/io.?. If left empty, all files are considered.Named Filter: Allows applying a Named Filter which overrides the currently set filters and column sorting. Named Filter management is possible in the Web UI. If a filter or sorting is changed, the dropdown switches to the last entry in the list[modified]which denotes the “unnamed filter” - meaning that the currently applied filters and sorting are not saved as a Named Filter.Private Names Filters are marked with the suffix
[^].
Show filter help: Opens a browser and shows the filter help.
The Axivion Visual Studio Code Plugin will automatically start a new query when any of the above options are changed.
Note
The Axivion Visual Studio Code Plugin does not support Local Build, Local Dashboard and Single File Analysis in restricted mode. Therefore the Local Build and Local Dashboard buttons will be disabled in untrusted workspaces.
Filtering
In addition to the file filter, the issue list view also supports filtering individual columns. You can type in the filter text boxes below the column headers to apply a filter to the respective column.
A more in-depth explanation on what filter-strings can be entered in the individual
columns is available when you click on the
Show filter help button.
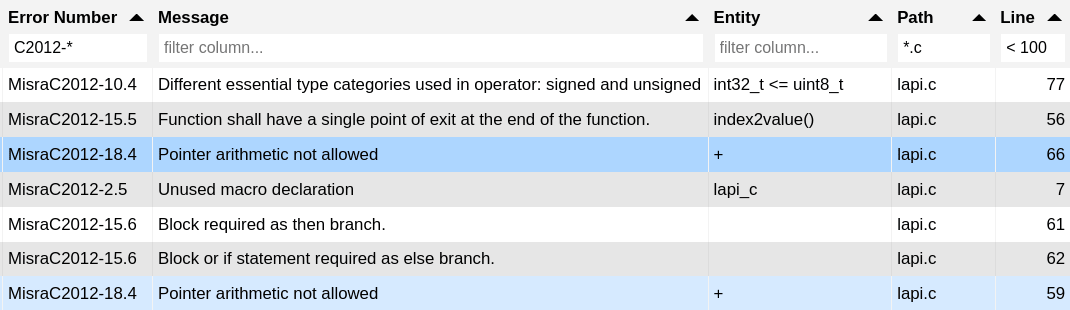
Filtering the issue list.
Sorting
The issue list can be sorted by clicking on the column headers. A normal click sorts the list just by the one column. To sort by multiple columns, hold shift while clicking on the row headers.
Note: Only the sorting arrows of manually clicked columns are highlighted. Sorting from named filters is applied but not colored due to implementation restrictions.
Go to Dashboard
Axivion Visual Studio Code Plugin allows you to quickly jump into the dashboard to view an issue, view the issue table, or to get the dashboard link of an issue to share it with a colleague.
This is done by right-clicking the requested issue. In the opening context menu you can select the appropriate option.
This is not possible when Local Build is activated.
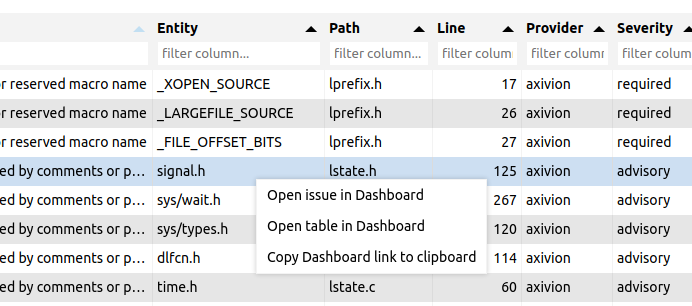
Open issue in dashboard context menu.
Note
When using the Open table in Dashboard entry while having a Named Filter
selected, you will be taken to an issue table with the Named Filter expanded, i.e. the
exact set of issues.
Viewing Issues
If you want to view some more details for an issue selected in the
Issues View, you can open the Issue Properties
using the command Axivion: Show Issue Properties.
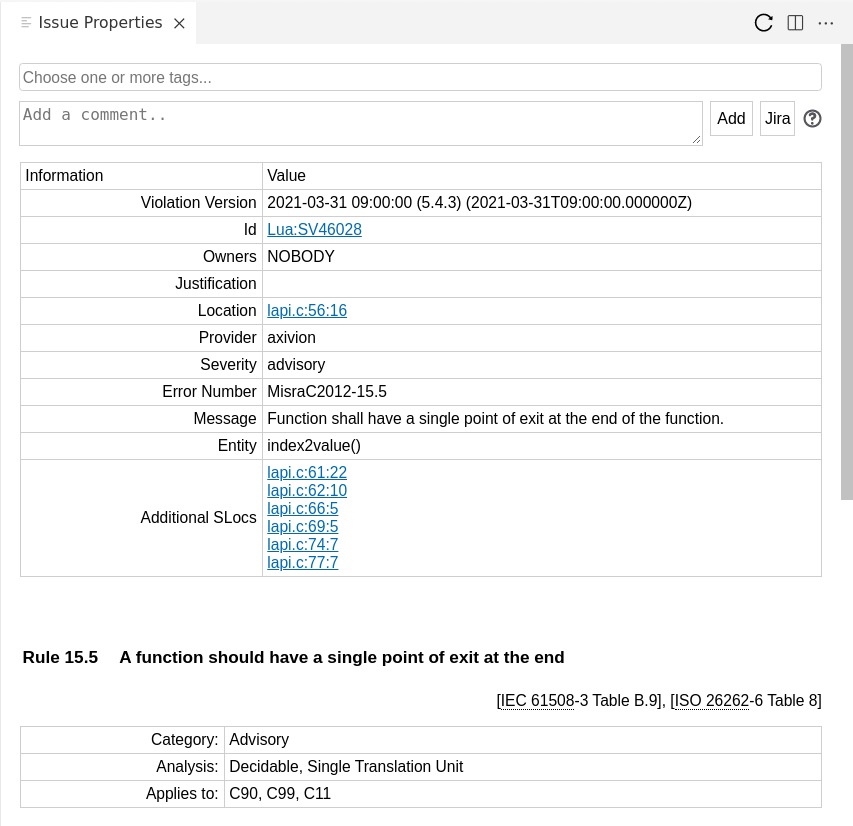
Issue Properties showing issue details
To open the code for an issue, double-click the entry in the issue list. If the path mapping is configured correctly, the plugin will open the source file and jump to the line containing the issue.
Because the analyzed version of the code is not necessarily the same as the local code version, the line numbers of issues may have changed. For example, an issue that was on line 100 during the analysis may now be on line 120 if 20 lines of code were added at the beginning of the file. When opening an issue, the Axivion Visual Studio Code Plugin will download the analyzed version of the file, and compute the new location of the issue using the diff between the analyzed file and the current editor contents.
5.5.5.2. Code Editor
If the path mapping is configured correctly, opening a code file in the Visual Studio Code
editor will display the issues found by the last analysis as gutter icons in the breakpoint area,
as a clickable CodeLens element which navigates to the Issue Properties
and as a Diagnostic (underlined code entity).
This is enabled by default and can be toggled using the command Axivion: Toggle Editor Markers.
Furthermore, issues are added to VSCode’s problem view.
Caution
When a new analysis has been performed, you may have to close and re-open the file to refresh the issue markers.
5.5.5.3. Local Analyses
Local analyses allow analysing code locally, before it is committed to version control. This requires the Axivion Suite to be installed locally (in addition to the Axivion Visual Studio Code Plugin). Please note that this requires some settings as described in Configuration.
Complete Project
We call a complete analysis of the whole project “Local Build”. This is documented in part Starting Local Build from within the IDE Plugins.
Offline Local Build
The Offline Local Build feature allows running Axivion Local Build without a connection to a remote dashboard server.
The User can select “Offline” as the dashboard in the Issues View, pick a project, and run the analysis directly from the IDE.
The Issues View is reloaded automatically after the build and displays the results.
When selecting a project, the project picker lists all projects that have previously been analyzed as well as any
Local Build configurations that do not yet have analysis data.
In addition, a special New project... option is available that prompts for a project name and creates
a new Local Build configuration for the project.
Single Compilation Unit
A single compilation unit can be analyzed for style violations using the
Axivion: Single File Analysis command in the command palette or via the context menu in the
File Explorer.
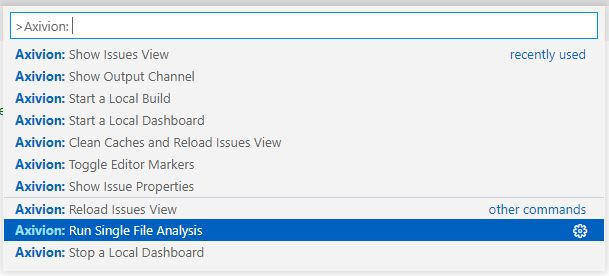
Single-File Analysis command in the Command Palette
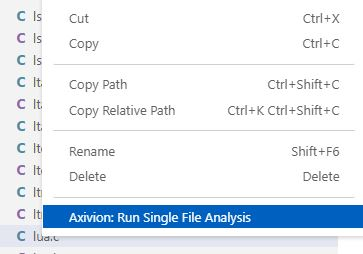
Single-File Analysis Command in the Explorer View
To successfully run this command in your workspace, please see the configuration example in the Single-File Analysis Settings section.
While the single-file analysis is running, an progress indicator offers a cancel button.

Cancel the Single-File Analysis
The results will be shown in Visual Studio Code’s Problems view.
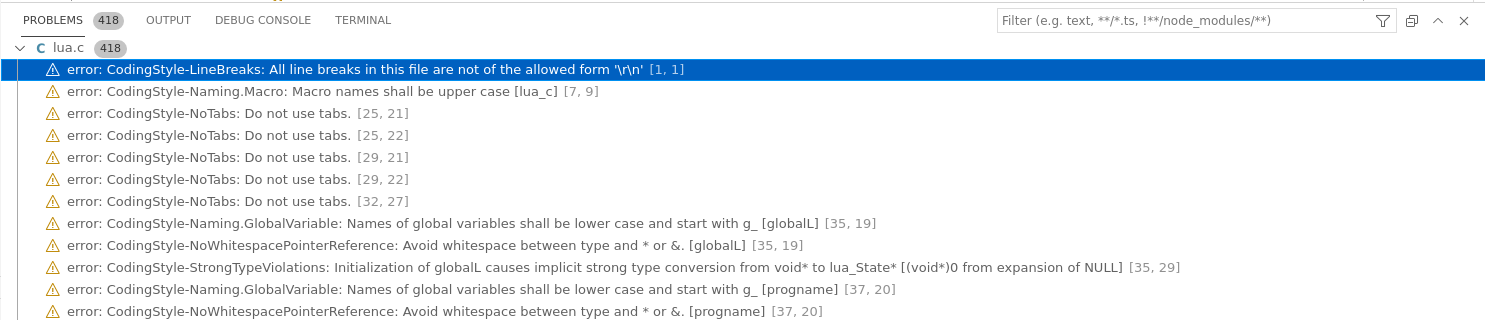
Single-File Analysis results in the Problems View
The single-file analysis creates markers for the found issues. These markers are shown additionally to the markers from the Axivion Dashboard Server or the Local Build. The single file analysis markers are cleared when a new single-file analysis runs.
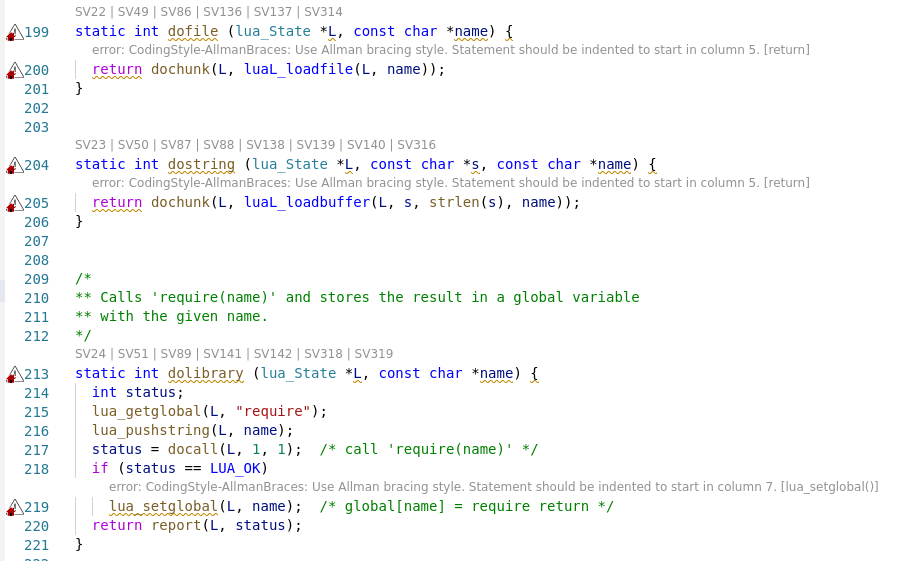
Single-File Analysis markers
Caution
To run the single-file analysis, the Axivion Suite used to analyze the file must be at least of version 7.0.0.
5.5.5.4. AI Chat Tools
The Axivion Visual Studio Code Plugin contributes tools to the VSCode AI Chat for LLMs to assist you in understanding and fixing Axivion Suite issues. When working with a chat agent, the agent now has the ability to query for markers in the current file or fetch details for specific issues. This allows the agent to provide more context-aware assistance, such as explaining the issues in the current file or suggesting fixes based on the issue details.
The Axivion Visual Studio Code Plugin tools can also be triggered manually by the user. Use #axivion_ in the chat to explore the tool options.
For AI assistance to work, make sure you have configured the Axivion Visual Studio Code Plugin according to the instructions in Configuration. Especially, a connection to the Axivion Dashboard Server and a path mapping is needed to access markers. Local Build and Single File Analysis configuration is needed, if the agent should be able to run local analyses.
Note
The tool #axivion_get_suppression_guidance needs axivion.experimental.languageModelTools.bauhausConfig to be set.
It defaults to ${workspaceFolder}/axivion.