CustomSeries QML Type
CustomSeriesタイプは、カスタマイズされたグラフタイプを表示できる。詳細...
| Import Statement: | import QtGraphs |
| Since: | Qt 6.11 |
| In C++: | QCustomSeries |
プロパティ
- delegate : Component
方法
- void append()
- void append(var data)
- void clear()
- void insert(int index)
- void insert(int index, var data)
- real mapX(real x)
- real mapY(real y)
- void remove(int index)
詳細説明
CustomSeries を使用してカスタマイズされたグラフを作成します。各要素のカスタムデータにアクセスできる散布図と考えてください。
CustomSeriesは、グラフに追加されたすべての項目をレンダリングするために使用されるデリゲートを定義します。各項目には、QVariantMap に格納されたユーザー定義データが含まれます。 グラフ内の項目のインデックスも自動的にデータマップに追加されます。QMLのコンテキストでは、バリアントマップはJavaScriptオブジェクトによって定義されます。このシリーズは、デリゲートに基づいて生成された各要素にこのマップを渡します。デリゲートはデータの使用方法を決定します。
GraphsView の軸で定義されたレンダリング座標にデータをマップするには、mapX とmapY 関数を使います。
注: 現在、カスタムシリーズ内の個々の要素は互いに情報を共有しません。このため、カスタム線系列を実装することはできません。
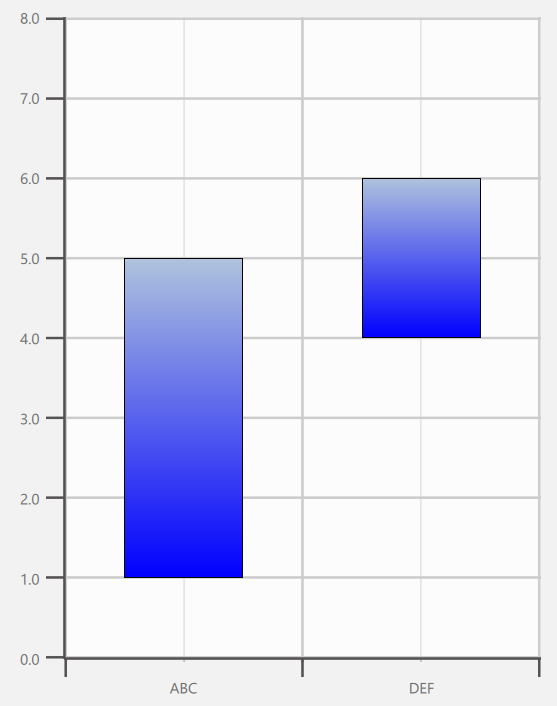
以下のコードでは、描かれたカスタムグラフを実装しています。この場合、カスタム・データにはupperとlowerの2つの値が含まれます。これらはデリゲートで定義され、要素の高さとy座標に影響します。
import QtQuick
import QtGraphs

Window {
    width: 640
    height: 480
    visible: true

    GraphsView {
        anchors.fill: parent

        axisX: BarCategoryAxis {
            categories: ["ABC", "DEF"]
        }

        axisY: ValueAxis {
            max: 8
            tickInterval: 1
        }

        CustomSeries {
            id: custom

            delegate: Rectangle {
                property var data
                gradient: Gradient {
                    GradientStop { position: 0.0; color: "lightsteelblue" }
                    GradientStop { position: 1.0; color: "blue" }
                }
                border.width: 1
                x: custom.mapX(data.index + 0.5) - width * 0.5
                y: custom.mapY((data.upper + data.lower) * 0.5) - height * 0.5
                width: Math.abs(custom.mapX(1) - custom.mapX(0)) * 0.5
                height: Math.abs(custom.mapY(data.upper) - custom.mapY(data.lower))
            }

            CustomSeriesData {
                data: ({
                    upper: 5,
                    lower: 1
                })
            }

            CustomSeriesData {
                data: ({
                    upper: 6,
                    lower: 4
                })
            }
        }
    }
}
プロパティのドキュメント
delegate : Component
デリゲートは提供されたカスタムデータに対応する要素をQMLに挿入するために使用されます。データはCustomSeries で定義され、"data" プロパティを通してデリゲートされた要素に与えられます。
delegate: Rectangle {
        property var data
        Rectangle {
            color: "tan"
            border.color: "black"
            border.width: 4
            y: series.mapY(data.index + 1) - height / 2 + 1
            x: series.mapX(data.median) - width / 2
            height: 32
            width: Math.abs(series.mapX(data.upperQuartile) - series.mapX(data.lowerQuartile))
        }
    }
}
メソッドのドキュメント
void append()
シリーズに空のデータ項目を追加する。
void append(var data)
data で定義されたデータ項目をシリーズに追加する。
void clear()
すべてのデータ項目をクリアする。
void insert(int index)
index の位置に空のデータ項目を追加する。
void insert(int index, var data)
data で定義されたデータ項目を、index の位置にあるシリーズに追加する。
real mapX(real x)
x 軸空間座標をレンダリング空間に変換して返す。
real mapY(real y)
y 軸空間座標をレンダリング空間に変換して返す。
void remove(int index)
位置index にあるデータ項目を削除する。
© 2026 The Qt Company Ltd. Documentation contributions included herein are the copyrights of their respective owners. The documentation provided herein is licensed under the terms of the GNU Free Documentation License version 1.3 as published by the Free Software Foundation. Qt and respective logos are trademarks of The Qt Company Ltd. in Finland and/or other countries worldwide. All other trademarks are property of their respective owners.
