GraphsView QML Type
すべてのQt Graphs ビューの基本型。もっと見る...
| Import Statement: | import QtGraphs |
- 継承されたメンバを含む、すべてのメンバの一覧
- GraphsView はQt Graphs QML Types for 2D に含まれます。
プロパティ
- axisX : AbstractAxis
- axisXSmoothing : real
- axisY : AbstractAxis
- axisYSmoothing : real
- clipPlotArea : bool
(since 6.10) - gridSmoothing : real
- marginBottom : real
- marginLeft : real
- marginRight : real
- marginTop : real
- orientation : Qt.Orientation
- panStyle : enumeration
- plotArea : rect
(since 6.9) - seriesList : list
- shadowBarWidth : real
- shadowColor : color
- shadowSmoothing : real
- shadowVisible : bool
- shadowXOffset : real
- shadowYOffset : real
- theme : GraphsTheme
- zoomAreaDelegate : Component
- zoomAreaEnabled : bool
- zoomSensitivity : real
- zoomStyle : enumeration
方法
- void addSeries(AbstractSeries series)
- bool hasSeries(AbstractSeries series)
- void insertSeries(int index, AbstractSeries series)
- void removeSeries(AbstractSeries series)
- void removeSeries(int index)
詳細説明
このクラスは、系列と主題を一緒に収集し、グラフを描画します。この型を使うにはQt Graphs モジュールをインポートする必要がある:
import QtGraphsその後、qmlファイルでGraphsViewを使用することができます:
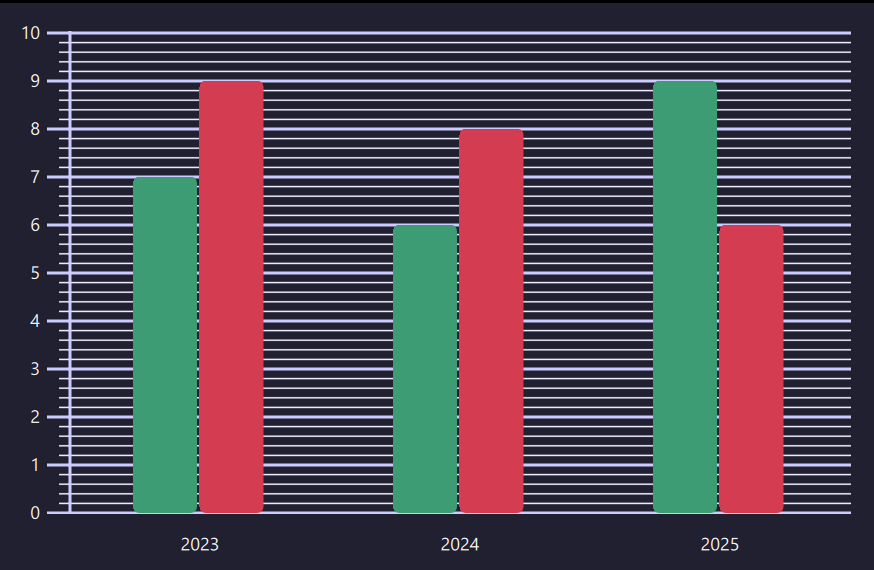
import QtQuick
import QtGraphs

GraphsView {
    anchors.fill: parent
    theme: GraphsTheme {
        colorScheme: GraphsTheme.ColorScheme.Dark
        seriesColors: ["#E0D080", "#B0A060"]
        borderColors: ["#807040", "#706030"]
        grid.mainColor: "#ccccff"
        grid.subColor: "#eeeeff"
        axisY.mainColor: "#ccccff"
        axisY.subColor: "#eeeeff"
    }
    axisX: BarCategoryAxis {
        categories: ["2023", "2024", "2025"]
        lineVisible: false
    }
    axisY: ValueAxis {
        min: 0
        max: 10
        subTickCount: 4
    }
    BarSeries {
        BarSet {
            values: [7, 6, 9]
        }
        BarSet {
            values: [9, 8, 6]
        }
    }
}
BarSeries,LineSeries,BarCategoryAxis,ValueAxis,GraphsThemeも参照 。
プロパティ・ドキュメント
axisX : AbstractAxis
このビュー内でシリーズに使用されるX軸。
注: 複数のGraphsViewに同じ軸を設定することはサポートされていません。
axisYも参照 。
axisXSmoothing : real
グラフ X 軸のスムージング(アンチエイリアス)量を制御する。デフォルトでは、スムージングは1.0 です。
axisY : AbstractAxis
このビュー内でシリーズに使用されるY軸。
注: 複数のGraphsViewに同じ軸を設定することはサポートされていません。
axisXも参照 。
axisYSmoothing : real
グラフ Y 軸のスムージング(アンチエイリアス)量を制御する。デフォルトでは、スムージングは1.0 です。
clipPlotArea : bool [since 6.10]
グラフアイテムがプロット領域の外に出た場合にクリップするかどうかを制御する。デフォルト値はtrue です。
このプロパティは Qt 6.10 で導入されました。
plotAreaも参照してください 。
gridSmoothing : real
グラフグリッドのスムージング(アンチエイリアス)量を制御する。デフォルトでは、スムージングは1.0 です。
marginBottom : real
グラフ下部の余白の量。デフォルトではマージンは20。
marginLeft : real
グラフの左側の余白の量。デフォルトではマージンは20。
marginRight : real
グラフの右側の余白の量。デフォルトではマージンは20。
marginTop : real
グラフ上部の余白の量。デフォルトではマージンは20。
orientation : Qt.Orientation
GraphsView の向きを決定します。この向きがQt.Horizontal の場合、axisX とaxisY は、axisX が縦に、axisY が横にレンダリングされるように位置を切り替えます。このプロパティは現在BarSeries で使用されています。 デフォルト値はQt.Vertical です。
panStyle : enumeration
GraphsView のパンスタイルを決定します。 パンはValueAxis のパンプロパティを操作することで動作します。 デフォルト値はGraphsView.PanStyle.None です。
| 定数 | 説明 |
|---|---|
GraphsView.PanStyle.None | パン機能は無効です。 |
GraphsView.PanStyle.Drag | マウスとタッチ ドラッグでビューをパンします。 |
plotArea : rect [read-only, since 6.9]
グラフが描画される矩形。これは、GraphsView 領域から軸領域とマージンを引いたものです。
このプロパティは Qt 6.9 で導入されました。
marginTop,marginBottom,marginLeft,marginRightも参照してください 。
seriesList : list [read-only]
GraphsView によってレンダリングされるシリーズのリスト。GraphsView のシリーズタイプの子要素で自動的に満たされる。
これはデフォルトのプロパティなので、子要素は自動的にシリーズリストに追加されます。
BarSeries,LineSeries,ScatterSeriesも参照 。
shadowBarWidth : real
グラフグリッドの影幅を制御する。デフォルトでは、影の幅は2.0 に設定されています。
shadowColor : color
グラフグリッドの影の色を制御する。デフォルトでは、影の色はblack に設定されています。
shadowSmoothing : real
グラフグリッドのシャドウスムージング(アンチエイリアス)量を制御する。デフォルトでは、シャドウスムージングは4.0 に設定されています。
shadowVisible : bool
グラフグリッドの影を表示するかどうかを制御する。デフォルトでは、影の可視性はfalse に設定されています。
shadowXOffset : real
グラフグリッドの影の X オフセットを制御する。デフォルトでは、シャドウ X オフセットは0.0 に設定されています。
shadowYOffset : real
グラフグリッドの影の Y オフセットを制御する。デフォルトでは、シャドウ Y オフセットは0.0 に設定されています。
theme : GraphsTheme
グラフで使用するテーマ。カラーリング、軸線、フォントなどを決定する。テーマが設定されていない場合は、デフォルトのテーマが使用される。
zoomAreaDelegate : Component
ユーザーがドラッグして領域を拡大したときに描画される QML 要素を指定します。
zoomAreaEnabled : bool
ズーム・エリアはマウスとタッチのドラッグ操作で変更され、zoomAreaDelegate によって決定されたボックスを描画する。グラフを離すと、ValueAxis ズームとパンのプロパティが変更され、描画されたボックスが交差する領域のみが表示されます。
zoomAreaDelegateも参照 。
zoomSensitivity : real
ズーム中にズーム値が変化する速度を決定する。
zoomStyle : enumeration
GraphsView のズームスタイルを決定します。 ズームはValueAxis zoom プロパティを操作することで動作します。デフォルト値はGraphsView.ZoomStyle.None です。
| 定数 | 説明 |
|---|---|
GraphsView.ZoomStyle.None | ズームは無効です。 |
GraphsView.ZoomStyle.Center | ピンチズームとマウスホイールはグラフビューの中心に向かってズームします。 |
メソッドの説明
void addSeries(AbstractSeries series)
GraphsView にseries を追加する。series が NULL の場合、追加されない。series がすでにグラフに属している場合は、末尾に移動される。
bool hasSeries(AbstractSeries series)
series がグラフ内にあればtrue を返す。
void insertSeries(int index, AbstractSeries series)
index で指定された位置にseries を挿入する。series が NULL の場合、挿入されない。series がすでにグラフに属している場合は、index に移動される。
void removeSeries(AbstractSeries series)
グラフからseries を削除する。
void removeSeries(int index)
index で指定された系列をグラフから削除する。
© 2026 The Qt Company Ltd. Documentation contributions included herein are the copyrights of their respective owners. The documentation provided herein is licensed under the terms of the GNU Free Documentation License version 1.3 as published by the Free Software Foundation. Qt and respective logos are trademarks of The Qt Company Ltd. in Finland and/or other countries worldwide. All other trademarks are property of their respective owners.
