콕핏
그래프를 사용하여 비행기 조종석을 모방한 애플리케이션의 예시입니다.
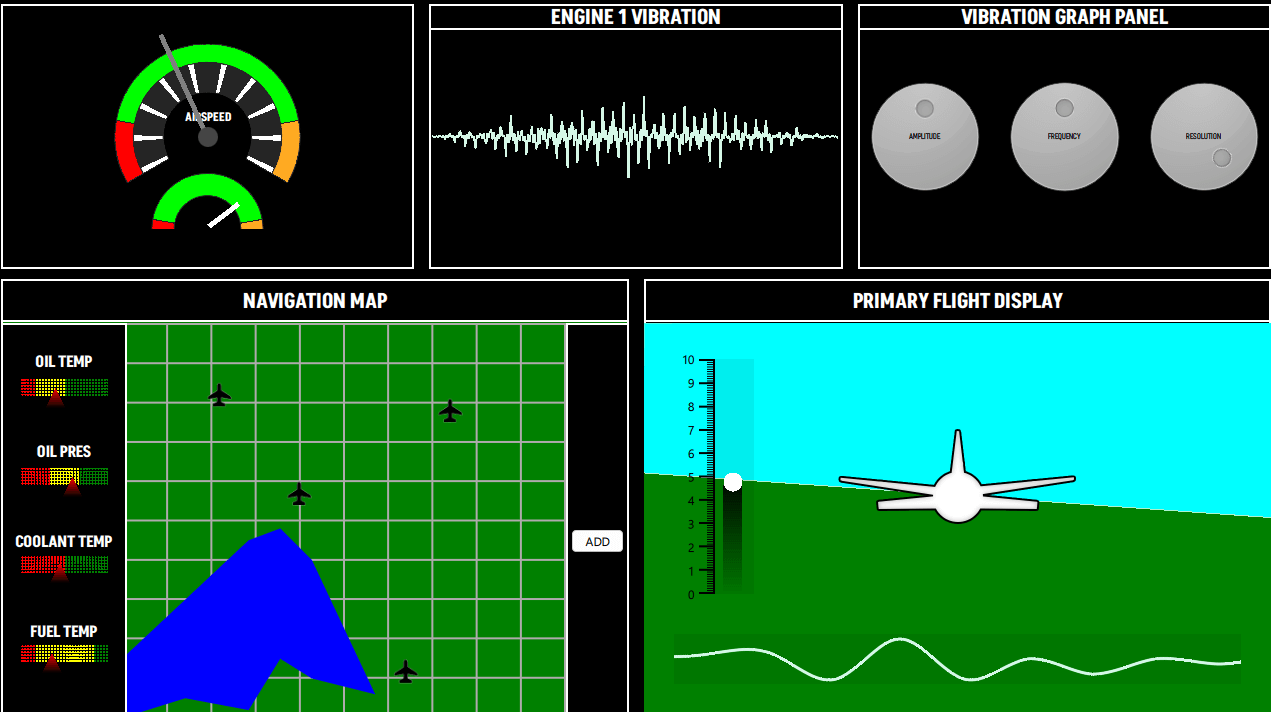
콕핏 예제에서는 다양한 그래프 유형을 사용하여 가상의 비행기 조종석 화면을 그립니다. 이 예제에서 사용된 그래프는 다음과 같습니다:
- PieSeries (속도계)
- LineSeries (진동 패널, 내비게이션 지도)
- AreaSeries (내비게이션 지도, 기본 비행 디스플레이)
- BarSeries (내비게이션 지도, 기본 비행 디스플레이)
- ScatterSeries (내비게이션 지도)
- SplineSeries (기본 비행 디스플레이)
예제 실행하기
에서 예제를 실행하려면 Qt Creator에서 Welcome 모드를 열고 Examples 에서 예제를 선택합니다. 자세한 내용은 Qt Creator: 튜토리얼을 참조하세요 : 빌드 및 실행을 참조하세요.
속도계
속도계 보기는 하나의 GraphsView 안에 3개의 PieSeries 으로 구성되며, 양쪽 다이얼의 바늘로 QML 직사각형을 사용합니다.
GraphsTheme 의 backgroundVisible 속성은 false 으로 설정되어 있습니다. 모든 PieSlices 에는 고유한 사용자 지정 색상이 있습니다. 가운데가 비어 있는 원형 눈금을 표시하기 위해 이 예제에서는 구멍 크기가 다른 PieSeries 을 사용합니다.
GraphsView {
    id: chart
    anchors.fill: parent
    anchors.margins: 20

    theme: GraphsTheme {
        backgroundVisible: false
        borderColors: ["#252525"]
    }

    PieSeries {
        id: pieOuter
        pieSize: 1
        holeSize: 0.8
        startAngle: -120
        endAngle: 120

        PieSlice { label: "Stall"; value: 1; color: "#ff0000"; labelVisible: false }
        PieSlice { label: "Optimal"; value: 4; color: "#00ff00"; labelVisible: false }
        PieSlice { label: "Overspeed"; value: 1; color: "#ffaa22"; labelVisible: false }
    }

    PieSeries {
        pieSize: 0.8
        holeSize: 0.6
        startAngle: -120
        endAngle: 120

        PieSlice { value: 1; color: "#ffffff"; }
        PieSlice { value: 4; color: "#252525"; }
        PieSlice { value: 1; color: "#ffffff"; }
        PieSlice { value: 4; color: "#252525"; }
        PieSlice { value: 1; color: "#ffffff"; }
        PieSlice { value: 4; color: "#252525"; }
        PieSlice { value: 1; color: "#ffffff"; }
        PieSlice { value: 4; color: "#252525"; }
        PieSlice { value: 1; color: "#ffffff"; }
        PieSlice { value: 4; color: "#252525"; }
        PieSlice { value: 1; color: "#ffffff"; }
        PieSlice { value: 4; color: "#252525"; }
        PieSlice { value: 1; color: "#ffffff"; }
        PieSlice { value: 4; color: "#252525"; }
        PieSlice { value: 1; color: "#ffffff"; }
        PieSlice { value: 4; color: "#252525"; }
        PieSlice { value: 1; color: "#ffffff"; }
        PieSlice { value: 4; color: "#252525"; }
        PieSlice { value: 1; color: "#ffffff"; }
    }

    PieSeries {
        pieSize: 0.6
        holeSize: 1.0
        startAngle: -120
        endAngle: 120
        verticalPosition: 1

        PieSlice { label: "Stall"; value: 1; color: "#ff0000"; labelVisible: false }
        PieSlice { label: "Optimal"; value: 4; color: "#00ff00"; labelVisible: false  }
        PieSlice { label: "Overspeed"; value: 1; color: "#ffaa22"; labelVisible: false  }
    }
}
진동 패널
진동 패널에는 런타임에 동적으로 업데이트되는 LineSeries 이 포함되어 있습니다. 실행 후 QML 호출 추가 함수를 사용하여 일련의 포인트 세트가 시리즈에 추가됩니다. 그런 다음 각 프레임에서 값 대체 기능을 사용하여 값을 계산된 값으로 대체합니다. 사용자는 진동 그래프 패널을 통해 이러한 값을 변경할 수 있습니다.
LineSeries {
    id: line
    property int divisions: 500
    property real amplitude: 0.5
    property real resolution: 0.5

    FrameAnimation {
        running: true

        onTriggered: {
            for (let i = 0; i < line.divisions; ++i) {
                let y = Math.sin(line.resolution*i)
                y *= Math.cos(i)
                y *= Math.sin(i / line.divisions * 3.2) * 3 * line.amplitude * Math.random()

               line.replace(i, (i/line.divisions) * 8.0, y + 4)
            }
        }
    }

    Component.onCompleted: {
        for (let i = 1; i <= divisions; ++i) {
            append((i/divisions) * 8.0, 4.0)
        }
    }

    function change(newDivs) {
        let delta = newDivs - divisions

        if (delta < 0) {
            delta = Math.abs(delta)
            removeMultiple(count - 1 - delta, delta)
        } else {
            for (let i = 0; i < delta; ++i) {
                append(((count + i)/divisions) * 8.0, 4.0)
            }
        }

        divisions = newDivs
    }
}
진동 그래프 패널
이 패널에는 진동 패널에 표시되는 시각화에 영향을 주는 값을 조정할 수 있는 컨트롤 노브가 있습니다.
내비게이션 맵
내비게이션 맵에는 두 개의 주요 섹션이 있습니다:
- 왼쪽 패널에는 BarSets 색상을 사용하여 각 막대의 음영을 지정하는 사용자 지정 셰이더가 포함된 BarSeries
BarSeries {
    property real barOpacity: 0.

    id: barSeries
    barsType: BarSeries.BarsType.Stacked
    barWidth: 0.2

    barDelegate: Item {
        id: delegate
        antialiasing: true
        property real barOpacity: 0.5
        property color barColor
        property string barLabel

        FrameAnimation {
            running: true
            onTriggered: {
                delegate.barOpacity = Math.abs(Math.sin(elapsedTime))
            }
        }
        ShaderEffect {
            id: effect
            readonly property alias iTime: delegate.barOpacity
            readonly property alias iColor: delegate.barColor
            readonly property vector3d iResolution: Qt.vector3d(width, height, 1.0)

            blending: true
            fragmentShader: 'bar.frag.qsb'
            anchors.fill: parent
        }
    }

    BarSet { id: set1; label: "Low"; values: [1, 2, 3, 1]; color: "red" }
    BarSet { id: set2; label: "Medium"; values: [2, 2, 0, 4]; color: "yellow"}
    BarSet { id: set3; label: "High"; values: [3, 2, 3, 1]; color: "green"}
}
- 오른쪽 패널에는 다음이 포함됩니다:
- LineSeries 두 개가 있는 AreaSeries 은 가상의 호수를 시각화합니다.
- 그 위에 ScatterSeries 은 지도 위에 공항과 같은 사용자 지정 아이콘을 표시합니다.
- 추가 버튼은 포인트를 이동하여 경로를 만들 수 있는 LineSeries 을 추가합니다. 이 LineSeries 은 포인트 델리게이트에 커스텀 셰이더를 사용하고 ScatterSeries 은 이미지를 사용합니다.
AreaSeries {
    property double x: 0
    property double y: 0

    id: lake1
    color: "blue"
    upperSeries: LineSeries {
        id: s1
        XYPoint { x: 0.0; y: -3.5 }
        XYPoint { x: 1.0; y: -5.0 }
        XYPoint { x: 2.0; y: -2.5 }
        XYPoint { x: 2.5; y: -4.0 }
        XYPoint { x: 3.0; y: -4.2 }
    }

    lowerSeries: LineSeries {
        id: s2
        XYPoint { x: 0.0; y: -7.2 }
        XYPoint { x: 1.0; y: -7.0 }
        XYPoint { x: 2.0; y: -8.5 }
        XYPoint { x: 2.5; y: -8.0 }
        XYPoint { x: 3.0; y: -9.0 }
        XYPoint { x: 4.0; y: -6.5 }
    }
}

AreaSeries {
    property double x: 0
    property double y: 0

    id: lake2
    color: "blue"
    upperSeries: LineSeries {
        id: s3
        XYPoint { x: 0.0; y: 1.5 }
        XYPoint { x: 1.0; y: 3.0 }
        XYPoint { x: 2.0; y: 4.5 }
        XYPoint { x: 2.5; y: 4.8 }
        XYPoint { x: 3.0; y: 4.0 }
    }

    lowerSeries: LineSeries {
        id: s4
        XYPoint { x: 0.0; y: 0.0 }
        XYPoint { x: 1.0; y: 0.5 }
        XYPoint { x: 2.0; y: 0.2 }
        XYPoint { x: 2.5; y: 1.5 }
        XYPoint { x: 3.0; y: 1.0 }
        XYPoint { x: 4.0; y: 0.6 }
    }
}

// POI
ScatterSeries {
    name: "Airport"

    pointDelegate: Image {
            source: "airplane-ico.png"
            mipmap: true
            width: 30
            height: 30
    }

    XYPoint{x: 4.0; y: 5.7}
    XYPoint{x: 2.2; y: 8.2}
    XYPoint{x: 6.4; y: 1.2}
    XYPoint{x: 7.4; y: 7.8}
}

LineSeries {
    id: linePath
    selectable: true
    draggable: true
    color: "white"
    pointDelegate: Item {
        width: 50
        height: 50
        property real pointValueX
        property real pointValueY

        FrameAnimation {
            id: scatterAnim
            running: true
        }

        ShaderEffect {
            readonly property vector3d iResolution: Qt.vector3d(width, height, 1.0)
            readonly property alias iTime: scatterAnim.elapsedTime

            blending: true
            fragmentShader: 'circleMarker.frag.qsb'
            anchors.fill: parent
        }

        Text {
            color: "white"
            font.pointSize: 4
            text: "LAT: " + pointValueX.toFixed(1) + ", " + "LON: " + pointValueY.toFixed(1)
        }
    }
}
기본 비행 디스플레이
기본 비행 디스플레이는 지형의 "3D" 보기를 모방한 것이 특징입니다. 두 개의 AreaSeries 로 구현되어 각각 사용자 지정 색상으로 지상과 하늘을 나타냅니다. FrameAnimation 은 이 시리즈의 값을 업데이트합니다.
AreaSeries {
    id: upperArea
    color: "cyan"

    upperSeries: LineSeries {
        XYPoint {x: 0; y: 10}
        XYPoint {x: 10; y: 10}
    }

    lowerSeries: LineSeries {
        id: upperLine
        XYPoint {x: 0; y: 3}
        XYPoint {x: 10; y: 4}
    }
}

FrameAnimation {
    running: true
    onTriggered: {
        upperLine.replace(0, upperLine.at(0).x, Math.sin(elapsedTime) + 6)
        upperLine.replace(1, upperLine.at(1).x, Math.cos(elapsedTime) + 6)
        lowerLine.replace(0, lowerLine.at(0).x, Math.sin(elapsedTime) + 6)
        lowerLine.replace(1, lowerLine.at(1).x, Math.cos(elapsedTime) + 6)
        barSet.values = [Math.sin(elapsedTime) + 5]
    }
}
왼쪽에는 테마가 지정된 BarSeries 에 Y축 레이블이 표시됩니다. 이 BarSeries 역시 막대에 사용자 지정 셰이더를 사용합니다.
BarSeries {
    id: barSeries
    selectable: true
    barDelegate: Item {
        id: delegate
        antialiasing: true
        property real barOpacity: 0.5
        property color barColor
        property string barLabel

        ShaderEffect {
            id: effect
            readonly property vector3d iResolution: Qt.vector3d(width, height, 1.0)

            blending: true
            fragmentShader: 'pitchbar.frag.qsb'
            anchors.fill: parent
        }
    }

    BarSet { id: barSet; values: []; selectedColor: "red" }
}
뷰 아래쪽의 SplineSeries 은 평면 아래의 지형 높이를 시각화합니다. SplineSeries 은 각 프레임마다 업데이트됩니다. 시리즈를 업데이트하는 코드는 연속된 일련의 점을 뒤쪽에 추가하고 앞쪽에서 제거합니다. 마우스를 가져가면 SplineSeries 에 y축 값(고도)을 표시하는 툴팁이 표시됩니다.
GraphsView {
    anchors.fill: parent
    anchors.leftMargin: -90
    anchors.rightMargin: -80
    anchors.bottomMargin: -30

    theme: GraphsTheme {
        backgroundVisible: false
        plotAreaBackgroundColor: "#11000000"
    }

    axisX: ValueAxis {
        max: 10
        subTickCount: 9
        lineVisible: false
        gridVisible: false
        subGridVisible: false
        labelsVisible: false
        visible: false
    }

    axisY: ValueAxis {
        max: 10
        subTickCount: 9
        lineVisible: false
        gridVisible: false
        subGridVisible: false
        labelsVisible: false
        visible: false
    }

    ToolTip {
        id: tooltip
    }

    onHoverEnter: {
        tooltip.visible = true;
    }

    onHoverExit: {
        tooltip.visible = false;
    }

    onHover: (seriesName, position, value) => {
                 tooltip.x = position.x + 1;
                 tooltip.y = position.y + 1;
                 tooltip.text = "Altitude: " + (value.y * 1000).toFixed(1) + "m";
             }

    FrameAnimation {
        property var points: []

        Component.onCompleted: {
            for (let i = 0; i < altitudeLine.count; ++i) {
                points[i] = altitudeLine.at(i)
            }
        }

        running: true
        onTriggered: {
            for (let i = 0; i < points.length; ++i) {
                points[i].x -= frameTime

                if (points[1].x <= -2) {
                    let p = points[0]
                    p.x = points[points.length - 1].x + 1
                    altitudeLine.append(p)
                    altitudeLine.remove(0)

                    points.length = 0

                    for (let i = 0; i < altitudeLine.count; ++i) {
                        points[i] = altitudeLine.at(i)
                    }
                }
            }
            altitudeLine.replace(points)
            altitudeLine.update()
        }
    }

    SplineSeries {
        id: altitudeLine
        hoverable: true
        width: 3

        XYPoint {x: 0; y: 5}
        XYPoint {x: 1; y: 2}
        XYPoint {x: 2; y: 5}
        XYPoint {x: 3; y: 4}
        XYPoint {x: 4; y: 6}
        XYPoint {x: 5; y: 7}
        XYPoint {x: 6; y: 9}
        XYPoint {x: 7; y: 8}
        XYPoint {x: 8; y: 9}
        XYPoint {x: 9; y: 6}
        XYPoint {x: 10; y: 6}
        XYPoint {x: 11; y: 6}
        XYPoint {x: 12; y: 1}
        XYPoint {x: 13; y: 9}
        XYPoint {x: 14; y: 1}
    }

}
© 2026 The Qt Company Ltd. Documentation contributions included herein are the copyrights of their respective owners. The documentation provided herein is licensed under the terms of the GNU Free Documentation License version 1.3 as published by the Free Software Foundation. Qt and respective logos are trademarks of The Qt Company Ltd. in Finland and/or other countries worldwide. All other trademarks are property of their respective owners.
