Debug on Linux
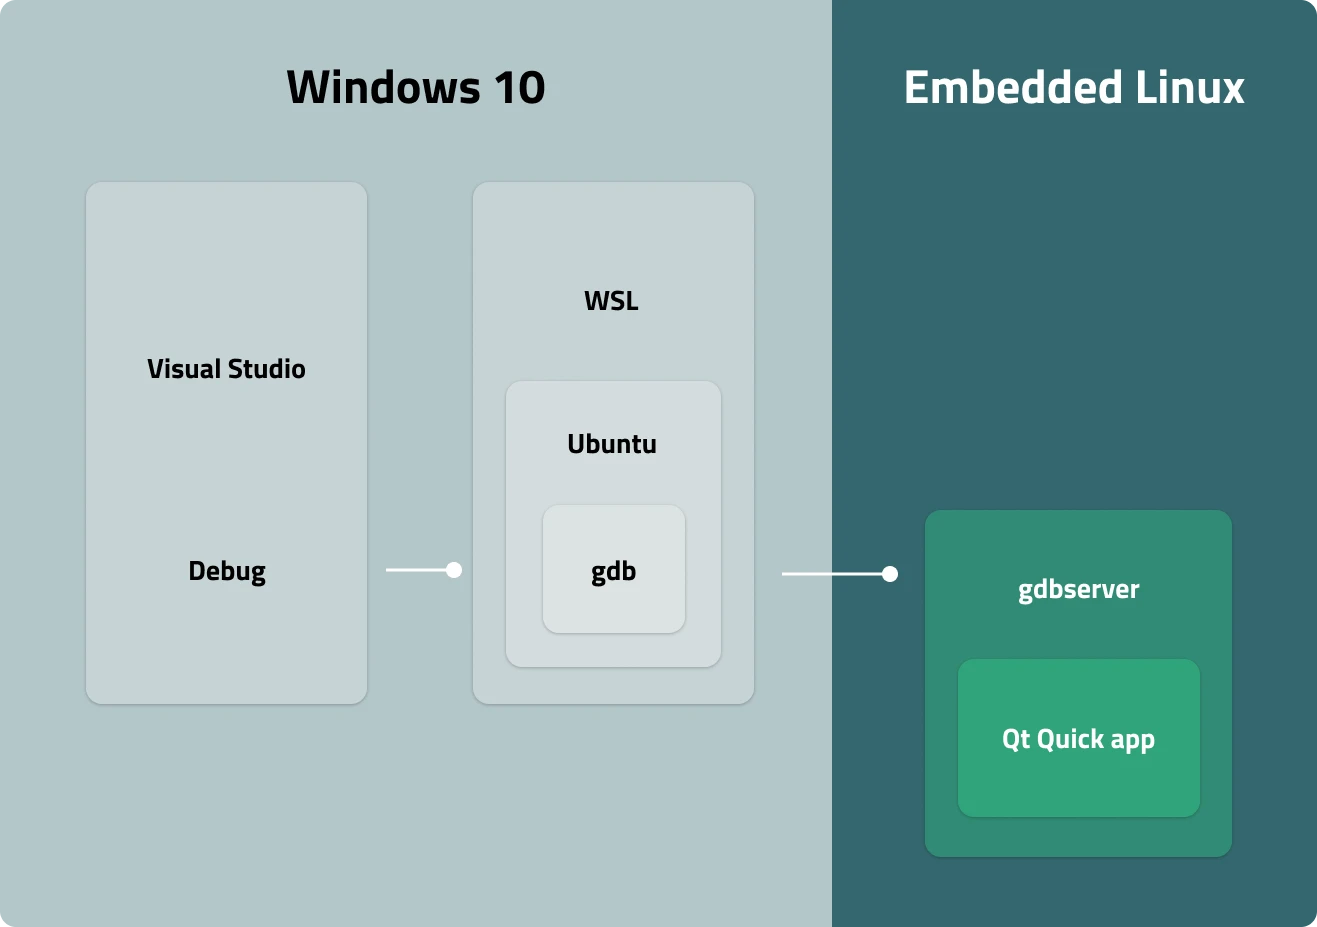
Set up Qt VS Tools for cross-compilation on Linux, to debug applications running on Linux devices. First launch the application using gdbserver and then configure GDB to connect to the device and start a remote debugging session.

For this to work, the GDB installed in the WSL must support the target device architecture. A simple way to achieve this is to install gdb-multiarch. To ensure that Visual Studio uses the correct debugger, create a symbolic link from gdb to gdb-multiarch.
Set up remote debugging
To set up the remote debugging session in Visual Studio, you must pass additional commands to GDB:
- Select a project in the Solution Explorer.
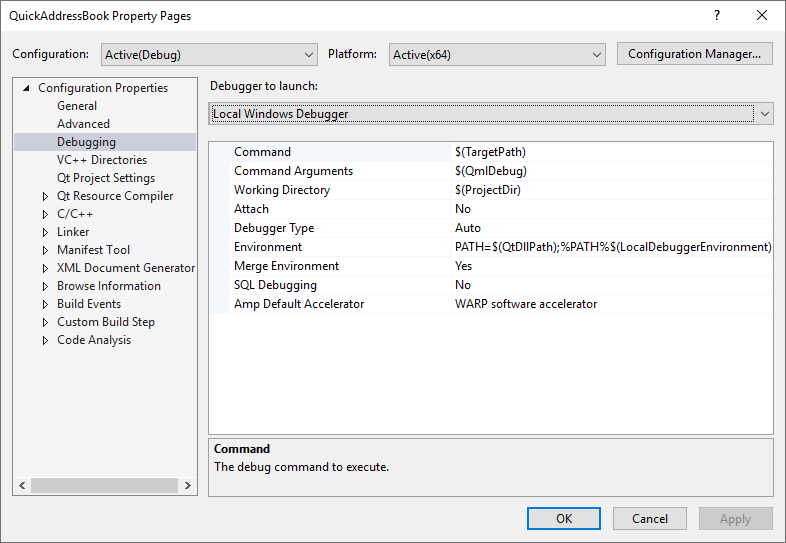
- Go to Project > Properties > Configuration Properties > Debugging.

- In Debugger to launch, select GDB Debugger.
- In Additional Debugger Commands, add the following commands:
target extended-remote <IP_address>:<port>
set remote exec-file <path_to_executable>
Set environment variables
Before starting the remote debugging session:
- Set the required environment variables:
- LD_LIBRARY_PATH specifies the path to the directory where you installed Qt binaries.
- QT_QPA_PLATFORM specifies the platform plugin, such as EGLFS, LinuxFB, DirectFB, or Wayland.
QT_QPA_PLATFORM_PLUGIN_PATHspecifies the path to the directory where you installed the platform plugin.- For the EGLFS platform,
QT_QPA_EGLFS_PHYSICAL_WIDTHandQT_QPA_EGLFS_PHYSICAL_HEIGHTspecify the screen width and height in millimeters. - QML2_IMPORT_PATH specifies the path to the directory where you installed QML modules.
- Launch
gdbserveron the device.
Start remote debugging
Press F5 to start the remote debugging session.
Set up debugging on Linux devices
To debug Qt Quick applications on Linux devices:
- Enable QML debugging for the project.
- Go to Project > Properties > Configuration Properties > Debugging to set up program arguments for starting a QML debugging session.
- In Debugger to launch, select GDB Debugger.
- In Additional Debugger Commands, add the following command:
-qmljsdebugger=port:<port>,host:<IP_address>,block
See also Tutorial: Qt Quick debugging, Cross-compile, Debug applications, Enable QML debugging, and Debugging Qt Quick applications.
© 2026 The Qt Company Ltd. Documentation contributions included herein are the copyrights of their respective owners. The documentation provided herein is licensed under the terms of the GNU Free Documentation License version 1.3 as published by the Free Software Foundation. Qt and respective logos are trademarks of The Qt Company Ltd in Finland and/or other countries worldwide. All other trademarks are property of their respective owners.

