LineSeries QML Type
Stellt Daten in Liniendiagrammen dar. Mehr...
| Import Statement: | import QtCharts 2.11 |
| In C++: | QLineSeries |
| Inherits: |
Eigenschaften
Detaillierte Beschreibung
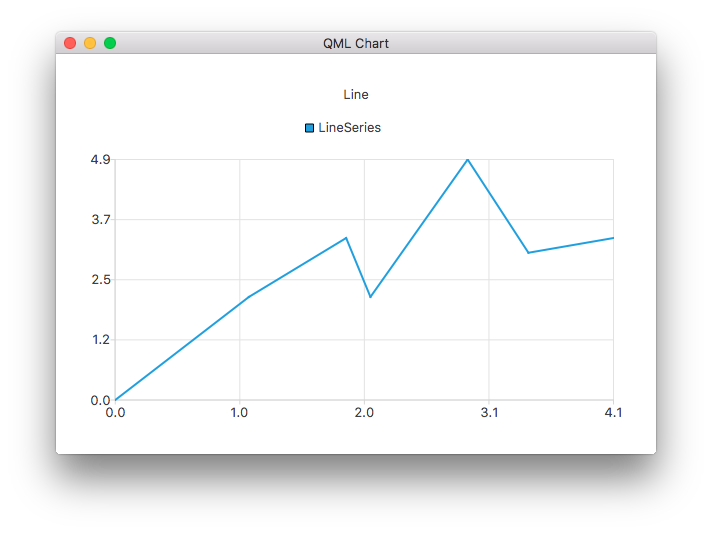
Ein Liniendiagramm wird verwendet, um Informationen als eine Reihe von Datenpunkten darzustellen, die durch gerade Linien verbunden sind.
Das folgende QML-Beispiel zeigt, wie man ein einfaches Liniendiagramm erstellt:
ChartView {
    title: "Line Chart"
    anchors.fill: parent
    antialiasing: true

    LineSeries {
        name: "Line"
        XYPoint { x: 0; y: 0 }
        XYPoint { x: 1.1; y: 2.1 }
        XYPoint { x: 1.9; y: 3.3 }
        XYPoint { x: 2.1; y: 2.1 }
        XYPoint { x: 2.9; y: 4.9 }
        XYPoint { x: 3.4; y: 3.0 }
        XYPoint { x: 4.1; y: 3.3 }
    }
}
Eigenschaft Dokumentation
capStyle : Qt::PenCapStyle
Steuert den Stil der Kappe für die Linie. Legen Sie einen der folgenden Werte fest: Qt.FlatCap, Qt.SquareCap oder Qt.RoundCap. Standardmäßig wird der Stil "Qt.SquareCap" verwendet.
Siehe auch Qt::PenCapStyle.
count : int
Die Anzahl der Datenpunkte in der Reihe.
style : Qt::PenStyle
Steuert den Stil der Zeile. Setzen Sie ihn auf einen der Werte Qt.NoPen, Qt.SolidLine, Qt.DashLine, Qt.DotLine, Qt.DashDotLine oder Qt.DashDotDotLine. Die Verwendung von Qt.CustomDashLine wird von der QML-API nicht unterstützt. Standardmäßig ist der Stil Qt.SolidLine.
Siehe auch Qt::PenStyle.
width : real
Die Breite der Linie. Standardmäßig ist die Breite 2,0.
© 2026 The Qt Company Ltd. Documentation contributions included herein are the copyrights of their respective owners. The documentation provided herein is licensed under the terms of the GNU Free Documentation License version 1.3 as published by the Free Software Foundation. Qt and respective logos are trademarks of The Qt Company Ltd. in Finland and/or other countries worldwide. All other trademarks are property of their respective owners.
