
StackedBarSeries QML Type
Stellt eine Reihe von Daten als vertikal gestapelte Balken dar, wobei jeder Balken einer Kategorie entspricht. Mehr...
| Import Statement: | import QtCharts 2.12 |
| In C++: | QStackedBarSeries |
| Inherits: | |
| Status: | Deprecated |
Dieser Typ ist veraltet. Wir raten dringend davon ab, ihn in neuem Code zu verwenden.
Ausführliche Beschreibung
Jeder der Reihe hinzugefügte Balkensatz trägt ein einzelnes Segment zu jedem gestapelten Balken bei.
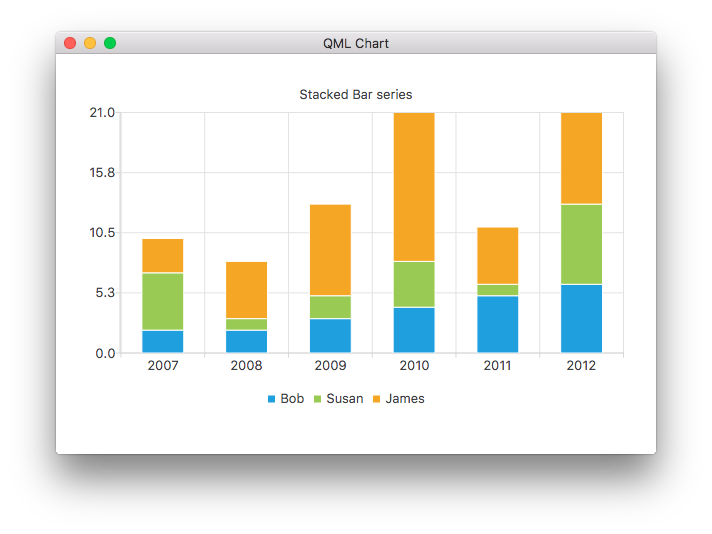
Der folgende QML-Code zeigt, wie man ein einfaches gestapeltes Balkendiagramm erstellt:
ChartView {
    title: "Stacked Bar Chart"
    anchors.fill: parent
    legend.alignment: Qt.AlignBottom
    antialiasing: true

    StackedBarSeries {
        axisX: BarCategoryAxis { categories: ["2007", "2008", "2009", "2010", "2011", "2012" ] }
        BarSet { label: "Bob"; values: [2, 2, 3, 4, 5, 6] }
        BarSet { label: "Susan"; values: [5, 1, 2, 4, 1, 7] }
        BarSet { label: "James"; values: [3, 5, 8, 13, 5, 8] }
    }
}
© 2026 The Qt Company Ltd. Documentation contributions included herein are the copyrights of their respective owners. The documentation provided herein is licensed under the terms of the GNU Free Documentation License version 1.3 as published by the Free Software Foundation. Qt and respective logos are trademarks of The Qt Company Ltd. in Finland and/or other countries worldwide. All other trademarks are property of their respective owners.
