
ScatterSeries QML Type
Der Typ „ScatterSeries“ stellt Daten in Streudiagrammen dar. Mehr...
| Import Statement: | import QtGraphs |
| In C++: | QScatterSeries |
| Inherits: |
- Liste aller Mitglieder, einschließlich geerbter Mitglieder
- „ScatterSeries“ ist Teil der QML-Typen für 2D von „Qt Graphs “.
Eigenschaften
- pointDelegate : Component
Ausführliche Beschreibung
Die Streudaten werden als Punktwolke im Diagramm dargestellt. Für jeden Punkt werden zwei Werte angegeben, die seine Position auf der horizontalen und der vertikalen Achse bestimmen.
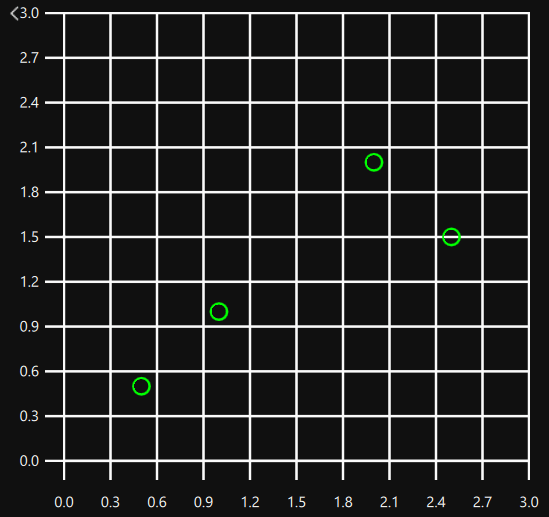
Sie können Streudiagrammdaten darstellen, indem Sie eine `ScatterSeries` innerhalb von ` GraphsView` erstellen. Die Daten können dem Diagramm hinzugefügt werden, indem Sie `XYPoints` als untergeordnete Elemente der `ScatterSeries` erstellen, die die x- und y-Werte jedes Punktes definieren.
GraphsView {
    anchors.fill: parent
    axisX: ValueAxis {
        max: 3
    }
    axisY: ValueAxis {
        max: 3
    }

    ScatterSeries {
        color: "#00ff00"
        XYPoint { x: 0.5; y: 0.5 }
        XYPoint { x: 1; y: 1 }
        XYPoint { x: 2; y: 2 }
        XYPoint { x: 2.5; y: 1.5 }
    }
}
Es können mehrere Streudiagramme erstellt werden, indem mehrere „ScatterSeries“ als untergeordnete Elemente von „ GraphsView “ hinzugefügt werden. In solchen Fällen sollte nur eine Serie die zu verwendende Achse definieren, da mehrere Definitionen die früheren einfach überschreiben.
GraphsView {
    anchors.fill: parent
    ScatterSeries {
        color: "#00ff00"
        axisX: ValueAxis {
            max: 3
        }
        axisY: ValueAxis {
            max: 3
        }

        XYPoint { x: 0.5; y: 0.5 }
        XYPoint { x: 1; y: 1 }
        XYPoint { x: 2; y: 2 }
        XYPoint { x: 2.5; y: 1.5 }
    }

    ScatterSeries {
        color: "#ff0000"
        XYPoint { x: 0.5; y: 3 }
        XYPoint { x: 1; y: 2 }
        XYPoint { x: 2; y: 2.5 }
        XYPoint { x: 2.5; y: 1 }
    }
}
Dokumentation zu den Eigenschaften
pointDelegate : Component
Zeigt die Punkte mit der angegebenen QML-Komponente an.
pointDelegate: Image {
    source: "images/happy_box.png"
}
© 2026 The Qt Company Ltd. Documentation contributions included herein are the copyrights of their respective owners. The documentation provided herein is licensed under the terms of the GNU Free Documentation License version 1.3 as published by the Free Software Foundation. Qt and respective logos are trademarks of The Qt Company Ltd. in Finland and/or other countries worldwide. All other trademarks are property of their respective owners.
