ScatterSeries QML Type
Der Typ ScatterSeries stellt Daten in Punktediagrammen dar. Mehr...
| Import Statement: | import QtCharts 2.11 |
| In C++: | QScatterSeries |
| Inherits: |
Eigenschaften
- borderColor : color
- borderWidth : real
- brush : brush
- brushFilename : string
- count : int
- markerShape : enumeration
- markerSize : real
Detaillierte Beschreibung
Die Streudaten werden als eine Sammlung von Punkten im Diagramm angezeigt. Für jeden Punkt werden zwei Werte angegeben, die seine Position auf der horizontalen Achse und der vertikalen Achse bestimmen.
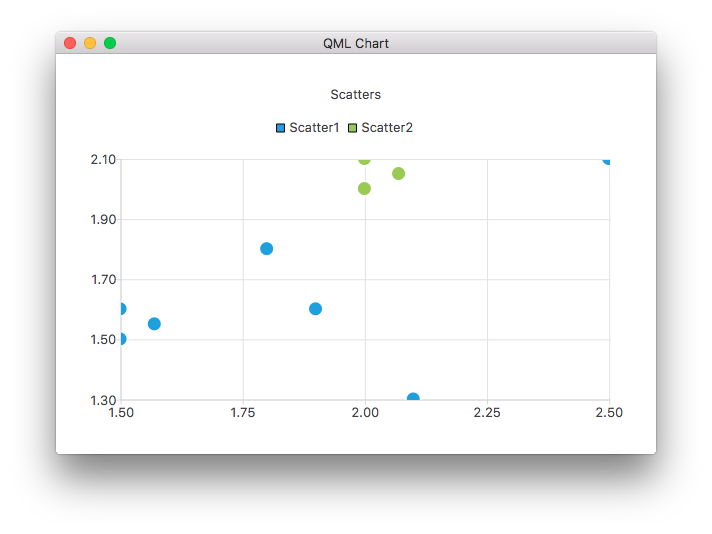
Der folgende QML-Code zeigt, wie man ein Diagramm mit zwei einfachen Streuungsreihen erstellt:
ChartView {
    title: "Scatter Chart"
    anchors.fill: parent
    antialiasing: true

    ScatterSeries {
        id: scatter1
        name: "Scatter A"
        XYPoint { x: 1.5; y: 1.5 }
        XYPoint { x: 1.5; y: 1.6 }
        XYPoint { x: 1.57; y: 1.55 }
        XYPoint { x: 1.8; y: 1.8 }
        XYPoint { x: 1.9; y: 1.6 }
        XYPoint { x: 2.1; y: 1.3 }
        XYPoint { x: 2.5; y: 2.1 }
    }

    ScatterSeries {
        name: "Scatter B"
        XYPoint { x: 2.0; y: 2.0 }
        XYPoint { x: 2.0; y: 2.1 }
        XYPoint { x: 2.07; y: 2.05 }
        XYPoint { x: 2.2; y: 2.9 }
        XYPoint { x: 2.4; y: 2.7 }
        XYPoint { x: 2.67; y: 2.65 }
    }
}
Weitere Informationen finden Sie unter Diagramme mit der QML-Galerie.
Dokumentation der Eigenschaft
borderColor : color
Die Farbe, die zum Zeichnen der Markierungsränder verwendet wird.
borderWidth : real
Die Breite der Umrandungslinie. Standardmäßig ist die Breite 2,0.
brush : brush
Der Pinsel, mit dem die Markierungen der Streuserien gezeichnet werden.
brushFilename : string
Der Name der Datei, die als Pinsel für die Serie verwendet wird.
count : int
Die Anzahl der Datenpunkte in der Reihe.
markerShape : enumeration
Die beim Rendern von Markierungselementen verwendete Form:
| Konstante | Beschreibung |
|---|---|
ScatterSeries.MarkerShapeCircle | Die Markierung ist ein Kreis. Dies ist der Standardwert. |
ScatterSeries.MarkerShapeRectangle | Die Markierung ist ein Rechteck. |
markerSize : real
Die Größe der Markierung, die zur Darstellung der Punkte in der Serie verwendet wird.
© 2026 The Qt Company Ltd. Documentation contributions included herein are the copyrights of their respective owners. The documentation provided herein is licensed under the terms of the GNU Free Documentation License version 1.3 as published by the Free Software Foundation. Qt and respective logos are trademarks of The Qt Company Ltd. in Finland and/or other countries worldwide. All other trademarks are property of their respective owners.
